How to Select Immersive Gateway Locations: A Data-Driven Framework for Destination Managers
Nov 21, 2025

How to Select Immersive Gateway Locations: A Data-Driven Framework for Destination Managers
The carrying capacity crisis that data can solve
Destination managers face an increasingly common problem: visitor numbers that exceed what ecosystems and communities can sustainably absorb. UN Tourism reports that overtourism affects destinations across all continents, with symptoms ranging from environmental degradation to resident pushback and declining visitor satisfaction (UNWTO overtourism framework).
The challenge is not simply "too many visitors" – it is too many visitors in too few places at the wrong times. Analysis of 88 destinations in the Global South shows that approximately 37% display explicit overtourism signals, with pressure concentrated at iconic hotspots rather than distributed across the wider destination system (Immersive Destination Analysis dataset, methodology).
Immersive gateways – fulldome theatres, mixed-reality galleries, flying theatres and narrative visitor centres – offer a solution grounded in visitor behaviour rather than restriction. When placed correctly, they redirect flows, substitute high-impact visits and turn education into a memorable pre-experience rather than an ignored information board.
This article presents a structured framework for selecting gateway locations, drawing on systematic destination analysis, infrastructure mapping and field insights from conservation practitioners. The framework is built to integrate with existing destination management processes and to produce investment-ready proposals that align with both ecological goals and financial sustainability.
For destination managers already familiar with the strategic case for immersive infrastructure, the companion analysis on Origins of Wonder as an immersive impact investment explores the investor landscape, unit economics and data foundations in more detail.
Why gateway location determines impact and ROI
Location determines three critical outcomes: visitor throughput, behavioural change effectiveness and capital efficiency.
Throughput determines financial viability. Immersive venues require consistent visitor numbers to cover operating costs and generate returns. Analysis of transport hubs, cruise terminals and park entry points across 75 tracked attractions shows that high-flow gateways can serve 200,000 to over 1 million annual visitors in compact footprints (immersive-destination-marketing dataset, raw JSON, schema).
A gateway at a secondary location with 50,000 annual visitors may struggle to cover projection systems, content refreshes and trained operators. The same infrastructure at a primary ferry terminal with 400,000 visitors becomes a cornerstone asset.
Timing determines effectiveness. Research on protected area visitor education shows that pre-visit interpretation changes behaviour more effectively than post-visit messaging (USGS review of low-impact education). Visitors who see fragile ecosystems rendered in immersive formats before they enter trails, dive sites or heritage cores arrive with different expectations and intentions.
This means gateways must be placed where visitors pass through before reaching sensitive zones – not as an afterthought next to the exit. Harbour fronts, airport arrival areas, shuttle departure points and park headquarters are structurally superior to locations inside the destination fabric.
Capital efficiency determines scalability. Infrastructure costs vary dramatically by site. Building in remote, topographically constrained or legally protected zones multiplies complexity and budget. Systematic destination profiling reveals that many high-pressure destinations already have underutilised spaces at key transit nodes – ferry waiting areas, cruise embarkation terminals, shuttle hubs – that can host modular immersive infrastructure with minimal new construction (Immersive Destination Analysis methodology).
Gateway location is not a creative choice – it is a structural decision that determines whether an immersive venue becomes a high-impact asset or an expensive experiment.
Seven-step framework for gateway location selection
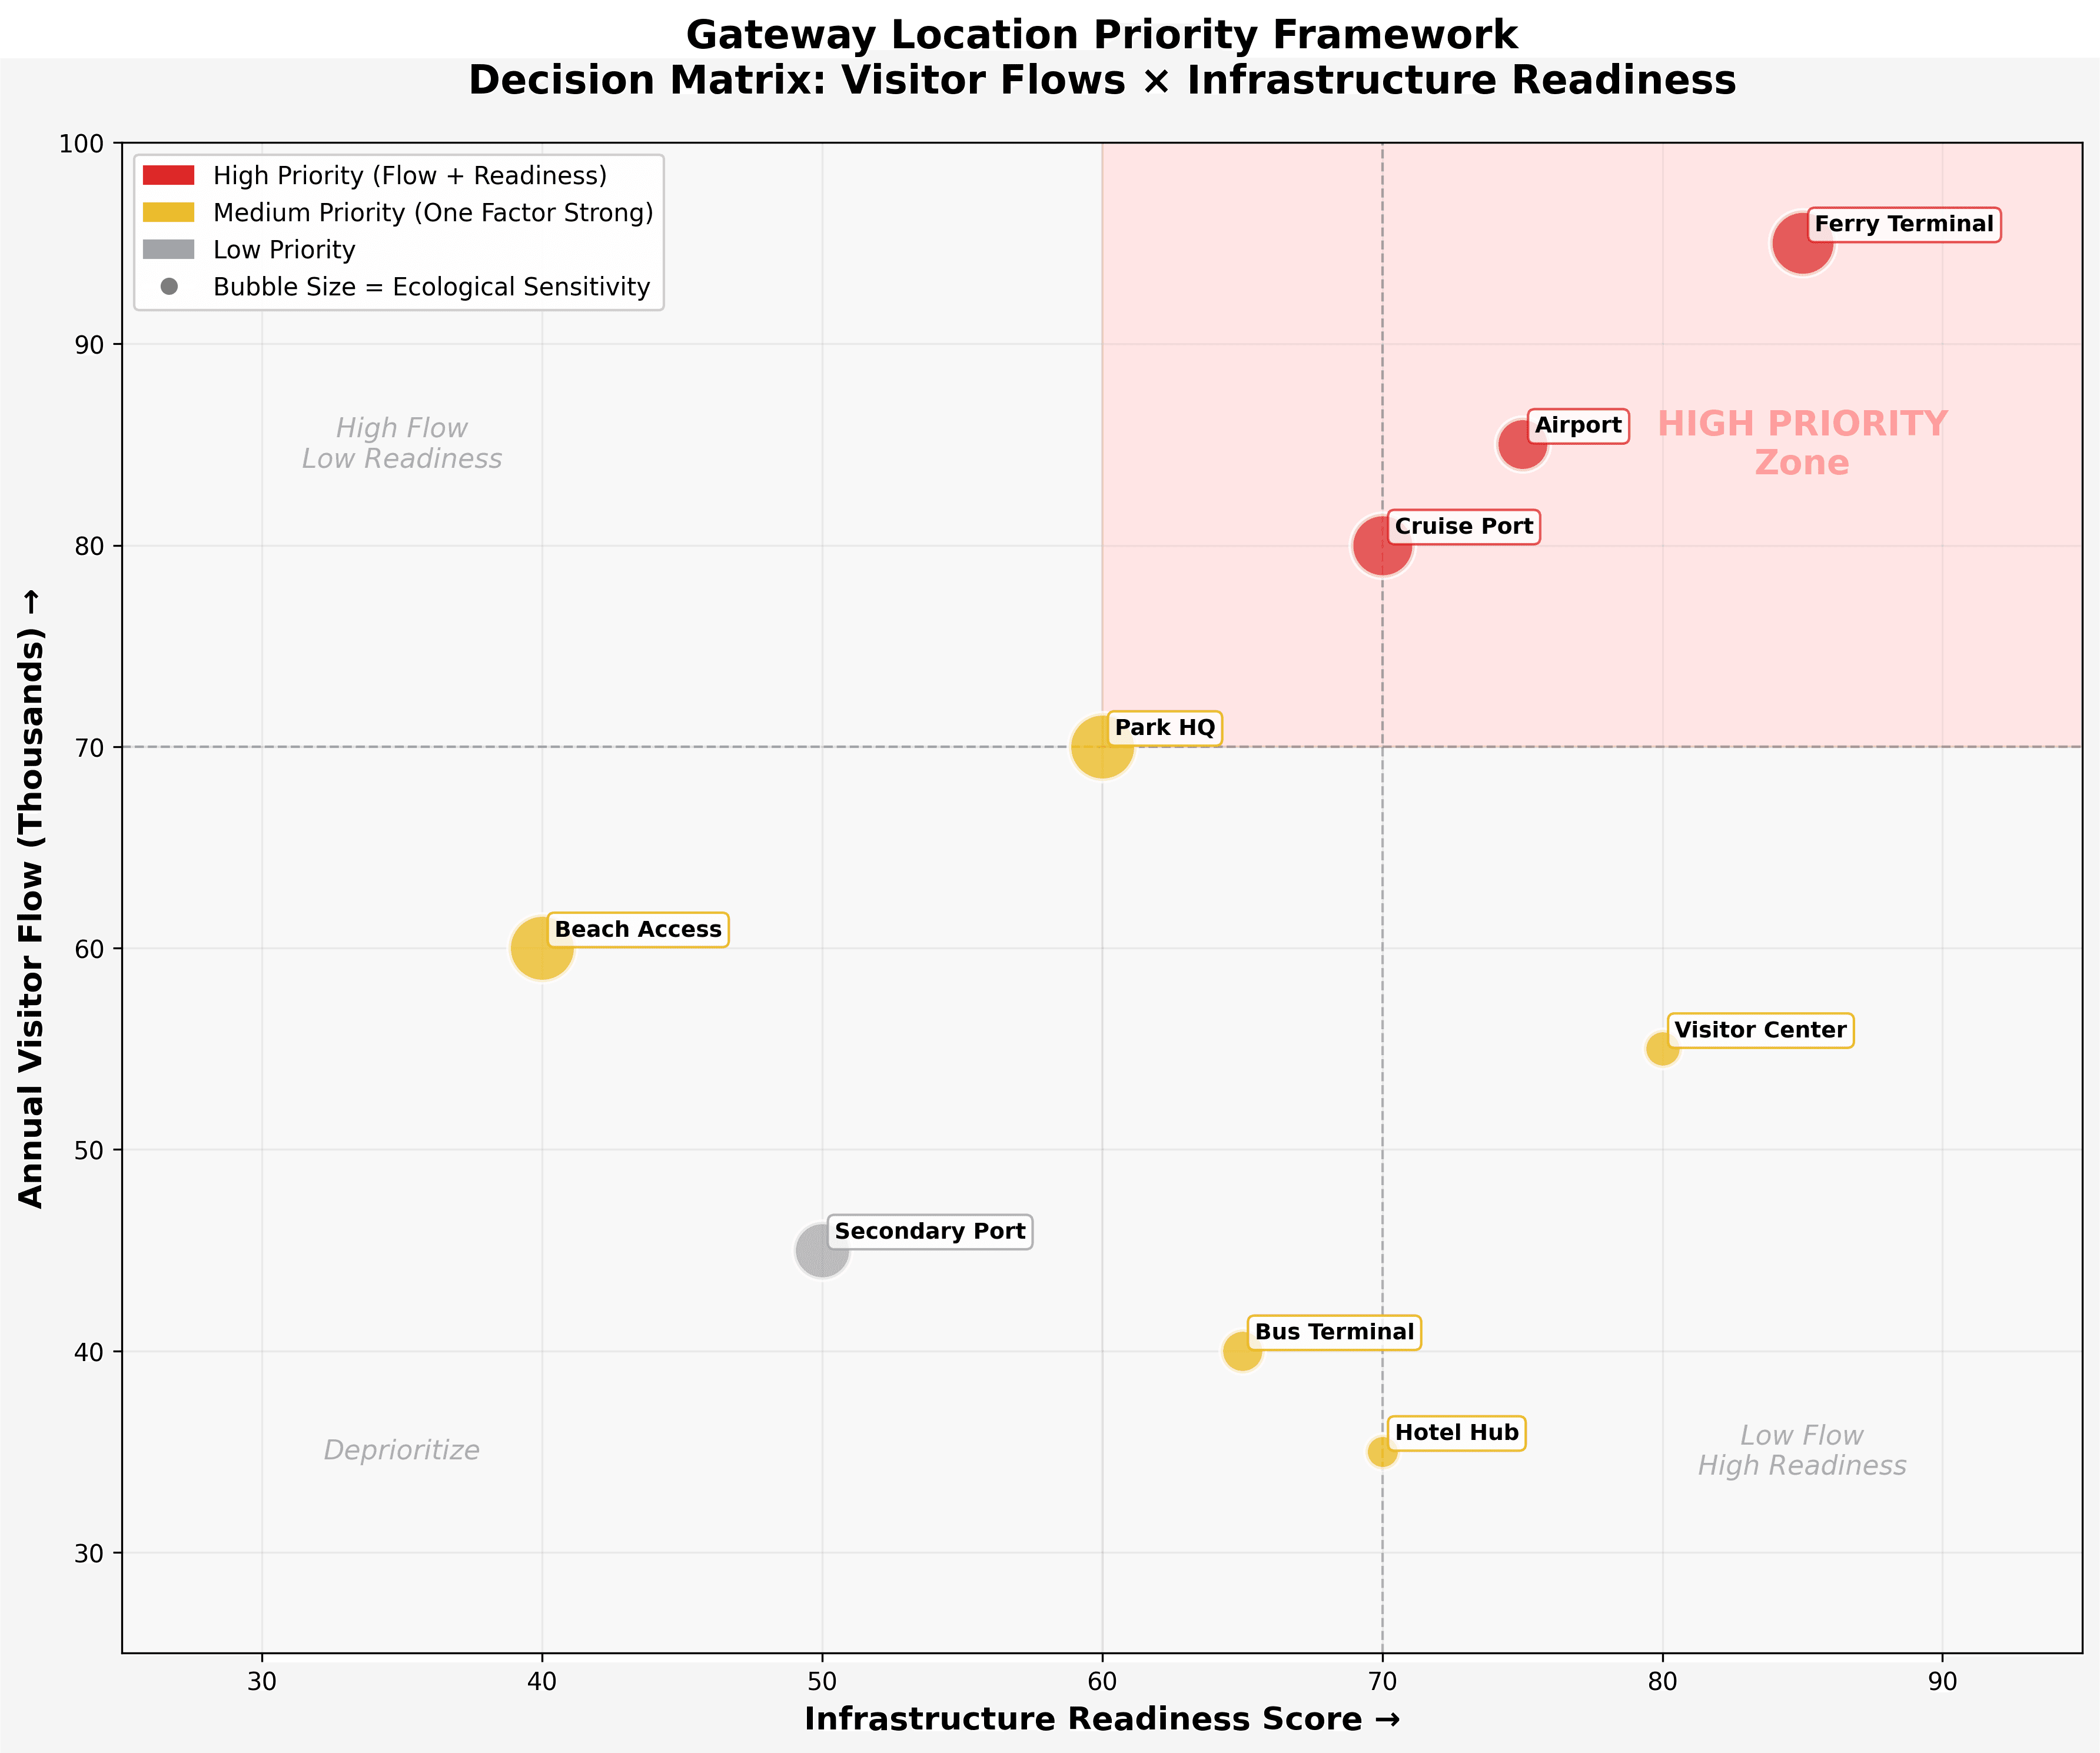
Decision framework for gateway placement based on visitor flows, ecological sensitivity and infrastructure readiness. Analysis of 88 destinations shows that ferry terminals and international airports consistently emerge as highest-priority locations due to high throughput combined with existing infrastructure. Bubble size indicates ecological sensitivity of the destination context. Red zones represent locations where both visitor flow and infrastructure readiness exceed critical thresholds. Data source: Immersive Destination Analysis dataset
This framework integrates data analysis, stakeholder coordination and site assessment into a repeatable process. It has been refined through destination impact assessments across marine reserves, UNESCO heritage sites and national park systems in Latin America, the Middle East and island destinations.
Step 1: Map current visitor flows and pressure points
Begin with a system view. Identify all major entry and circulation points – airports, ports, ferry terminals, bus stations, designated park entrances. Layer visitor volume data, seasonal patterns and dwell times.
Next, map ecological and social pressure indicators. Where do visitor numbers exceed carrying capacity? Which sites show habitat degradation, overcrowding or resident complaints? The Immersive Destination Analysis dataset documents that among destinations with quantified sustainability pressure, approximately 86% of high-pressure attractions lie inside protected or heritage areas – these are the priority zones where gateway interventions deliver maximum impact.
Create a visual overlay: visitor flow lines, capacity thresholds and existing infrastructure. This becomes the foundation for all subsequent decisions.
Data sources:
Destination management organisation (DMO) arrival statistics
Park authority visitor counts
Transport operator passenger data
Community surveys on tourism impact
Environmental monitoring reports
Output: Flow map showing volumes, seasonal patterns, and pressure hotspots
Step 2: Identify structural bottlenecks where visitors concentrate
Effective gateways sit at natural concentration points – places where visitor flows must pass through regardless of final destination. These bottlenecks create captive audiences with predictable dwell times.
Examples of high-value bottlenecks:
Island ferry terminals: All visitors arrive by sea, with 30–90 minute pre-boarding waiting periods
Park headquarters: Mandatory orientation stops before trail access
Cruise ship embarkation areas: Passengers gather before shore excursions
Airport arrival halls: First touchpoint for all air arrivals
Shuttle departure zones: Controlled access points to protected areas
In the Galápagos Islands, approximately 97% of land area is protected, with visitor flows concentrated through a handful of entry points (destination profile in Immersive Destination Analysis). A gateway at the main harbour or airport captures nearly every visitor before they disperse across islands.
Contrast this with diffuse destinations where visitors arrive through multiple uncontrolled points. These require either multiple smaller gateways or strategic placement at secondary concentration zones like shuttle hubs that serve key attractions.
Assessment criteria:
Percentage of total visitors passing through the point
Average dwell time at the location
Controllability of the access point
Timing relative to sensitive site visits
Output: Ranked list of structural bottleneck locations with throughput estimates
Step 3: Assess infrastructure readiness and site constraints
Not all bottlenecks are suitable for immersive infrastructure. Evaluate technical and regulatory feasibility.
Physical requirements:
Available footprint: 150–400 m² for dome theatres (12–20m diameter)
Load-bearing capacity for projection domes and seating
Electrical capacity for AV systems (typically 30–60 kW)
Climate control feasibility in tropical or extreme climates
Acoustic isolation from transport noise
Regulatory and ownership factors:
Land tenure and usage permissions
Protected area construction restrictions
Heritage site development guidelines
Building code compliance
Environmental impact assessment requirements
Existing infrastructure assets:
Underutilised waiting areas or transit halls
Visitor centre spaces with low activation
Waterfront promenades with seasonal congestion
Airport terminal expansion zones
Many destinations already have built spaces at key gateways that require adaptation rather than new construction. This dramatically reduces capital costs and regulatory friction.
Site assessment tool: Create a feasibility matrix scoring each location on: throughput potential (high/medium/low), infrastructure readiness (ready/moderate adaptation/major construction), regulatory complexity (simple/moderate/complex), and capital efficiency (excellent/good/acceptable).
Output: Shortlist of 2–4 viable gateway locations with technical summaries
Step 4: Model visitor experience and behavioural impact
Immersive gateways are not passive infrastructure – they are narrative instruments designed to shift visitor behaviour before physical site access.
Behavioural goals by destination type:
For overtourism destinations (beaches, reefs, heritage cores): | For protected areas with strict carrying capacities: | For heritage sites with cultural sensitivities: |
|---|---|---|
Reduce dwell time at most sensitive spots
| Prepare visitors for access restrictions and guidelines
| Contextualise significance before physical encounter
|
Experience design questions:
What do visitors need to understand before site access?
Which behaviours most damage the ecosystem or community?
What emotional connection makes rules feel intuitive rather than arbitrary?
How long do visitors naturally wait at this gateway?
Research on visitor education in protected areas indicates that interpretation aligned with visitor values produces stronger pro-environmental intentions than generic information (values-based interpretation study). Gateway content must connect destination protection to what visitors already care about.
Output: Behavioural change logic model for each shortlisted location
Step 5: Calculate unit economics and financial sustainability
Immersive gateways must be financially sustainable to remain operational over decades. Project revenue, operating costs and capital requirements for each location.
Revenue model components:
Ticket sales: | Ancillary revenue: |
|---|---|
Direct admission (€8–15 per person typical range)
| Content licensing to feeder city venues
|
Operating cost structure: | Capital expenditure: |
Staffing: operators, guides, maintenance technicians
| Infrastructure: dome structure, seating, AV systems
|
Reference case: A 16m diameter fulldome theatre at a ferry terminal serving 300,000 annual visitors, operating 8 shows per day in peak season (4 in low season), with $10 average ticket price and 60% seat fill generates approximately $600,000–800,000 gross annual revenue. Operating costs typically run 25–35% of revenue. Capital outlay ranges from $800,000 to $1.5 million depending on site conditions, implying 12–24 month payback periods in high-throughput locations.
The Origins of Wonder impact investment analysis documents unit economics showing 67% EBITDA margins and 12-month payback periods for well-sited gateways, based on systematic destination and investor profiling.
Financial assessment tool: Build a simple model with visitor volume scenarios (conservative/expected/optimistic), ticket pricing, and cost structure to test financial viability across locations.
Output: Financial feasibility summary for each shortlisted gateway location
Step 6: Align with policy frameworks and secure stakeholder buy-in
Gateway projects touch multiple jurisdictions and interest groups. Successful implementation requires early coordination.
Key stakeholder categories:
Public authorities:
Destination marketing organisations (DMOs)
National park or marine reserve management
Municipal or regional planning departments
Environmental protection agencies
Transport and port authorities
Private sector:
Ferry and cruise operators
Resort and hotel associations
Tour operators and excursion providers
Local business chambers
Community and civil society:
Resident associations
Indigenous or traditional landowner groups
Conservation NGOs
Cultural heritage organisations
Policy alignment checklist:
Does the gateway support existing destination management plans?
Is it compatible with protected area management objectives?
Does it contribute to carrying capacity management frameworks?
Can it integrate with transport or visitor flow management systems?
Does it create opportunities for local employment and procurement?
International guidelines on destination management emphasise multi-stakeholder governance structures where tourism businesses, authorities and communities co-design strategies (UNWTO DMO strengthening guidelines). Gateway projects benefit from this collaborative framing: they are visible, easy to understand and naturally suited to co-funding and co-branding.
Stakeholder engagement process:
Preliminary consultation with DMO and protected area authorities
Technical briefing for transport operators and site managers
Community information sessions on local benefits
Conservation partner review of behavioural change objectives
Formation of project steering group with multi-stakeholder representation
Output: Stakeholder map with roles, interests, concerns and engagement status
Step 7: Develop phased implementation roadmap
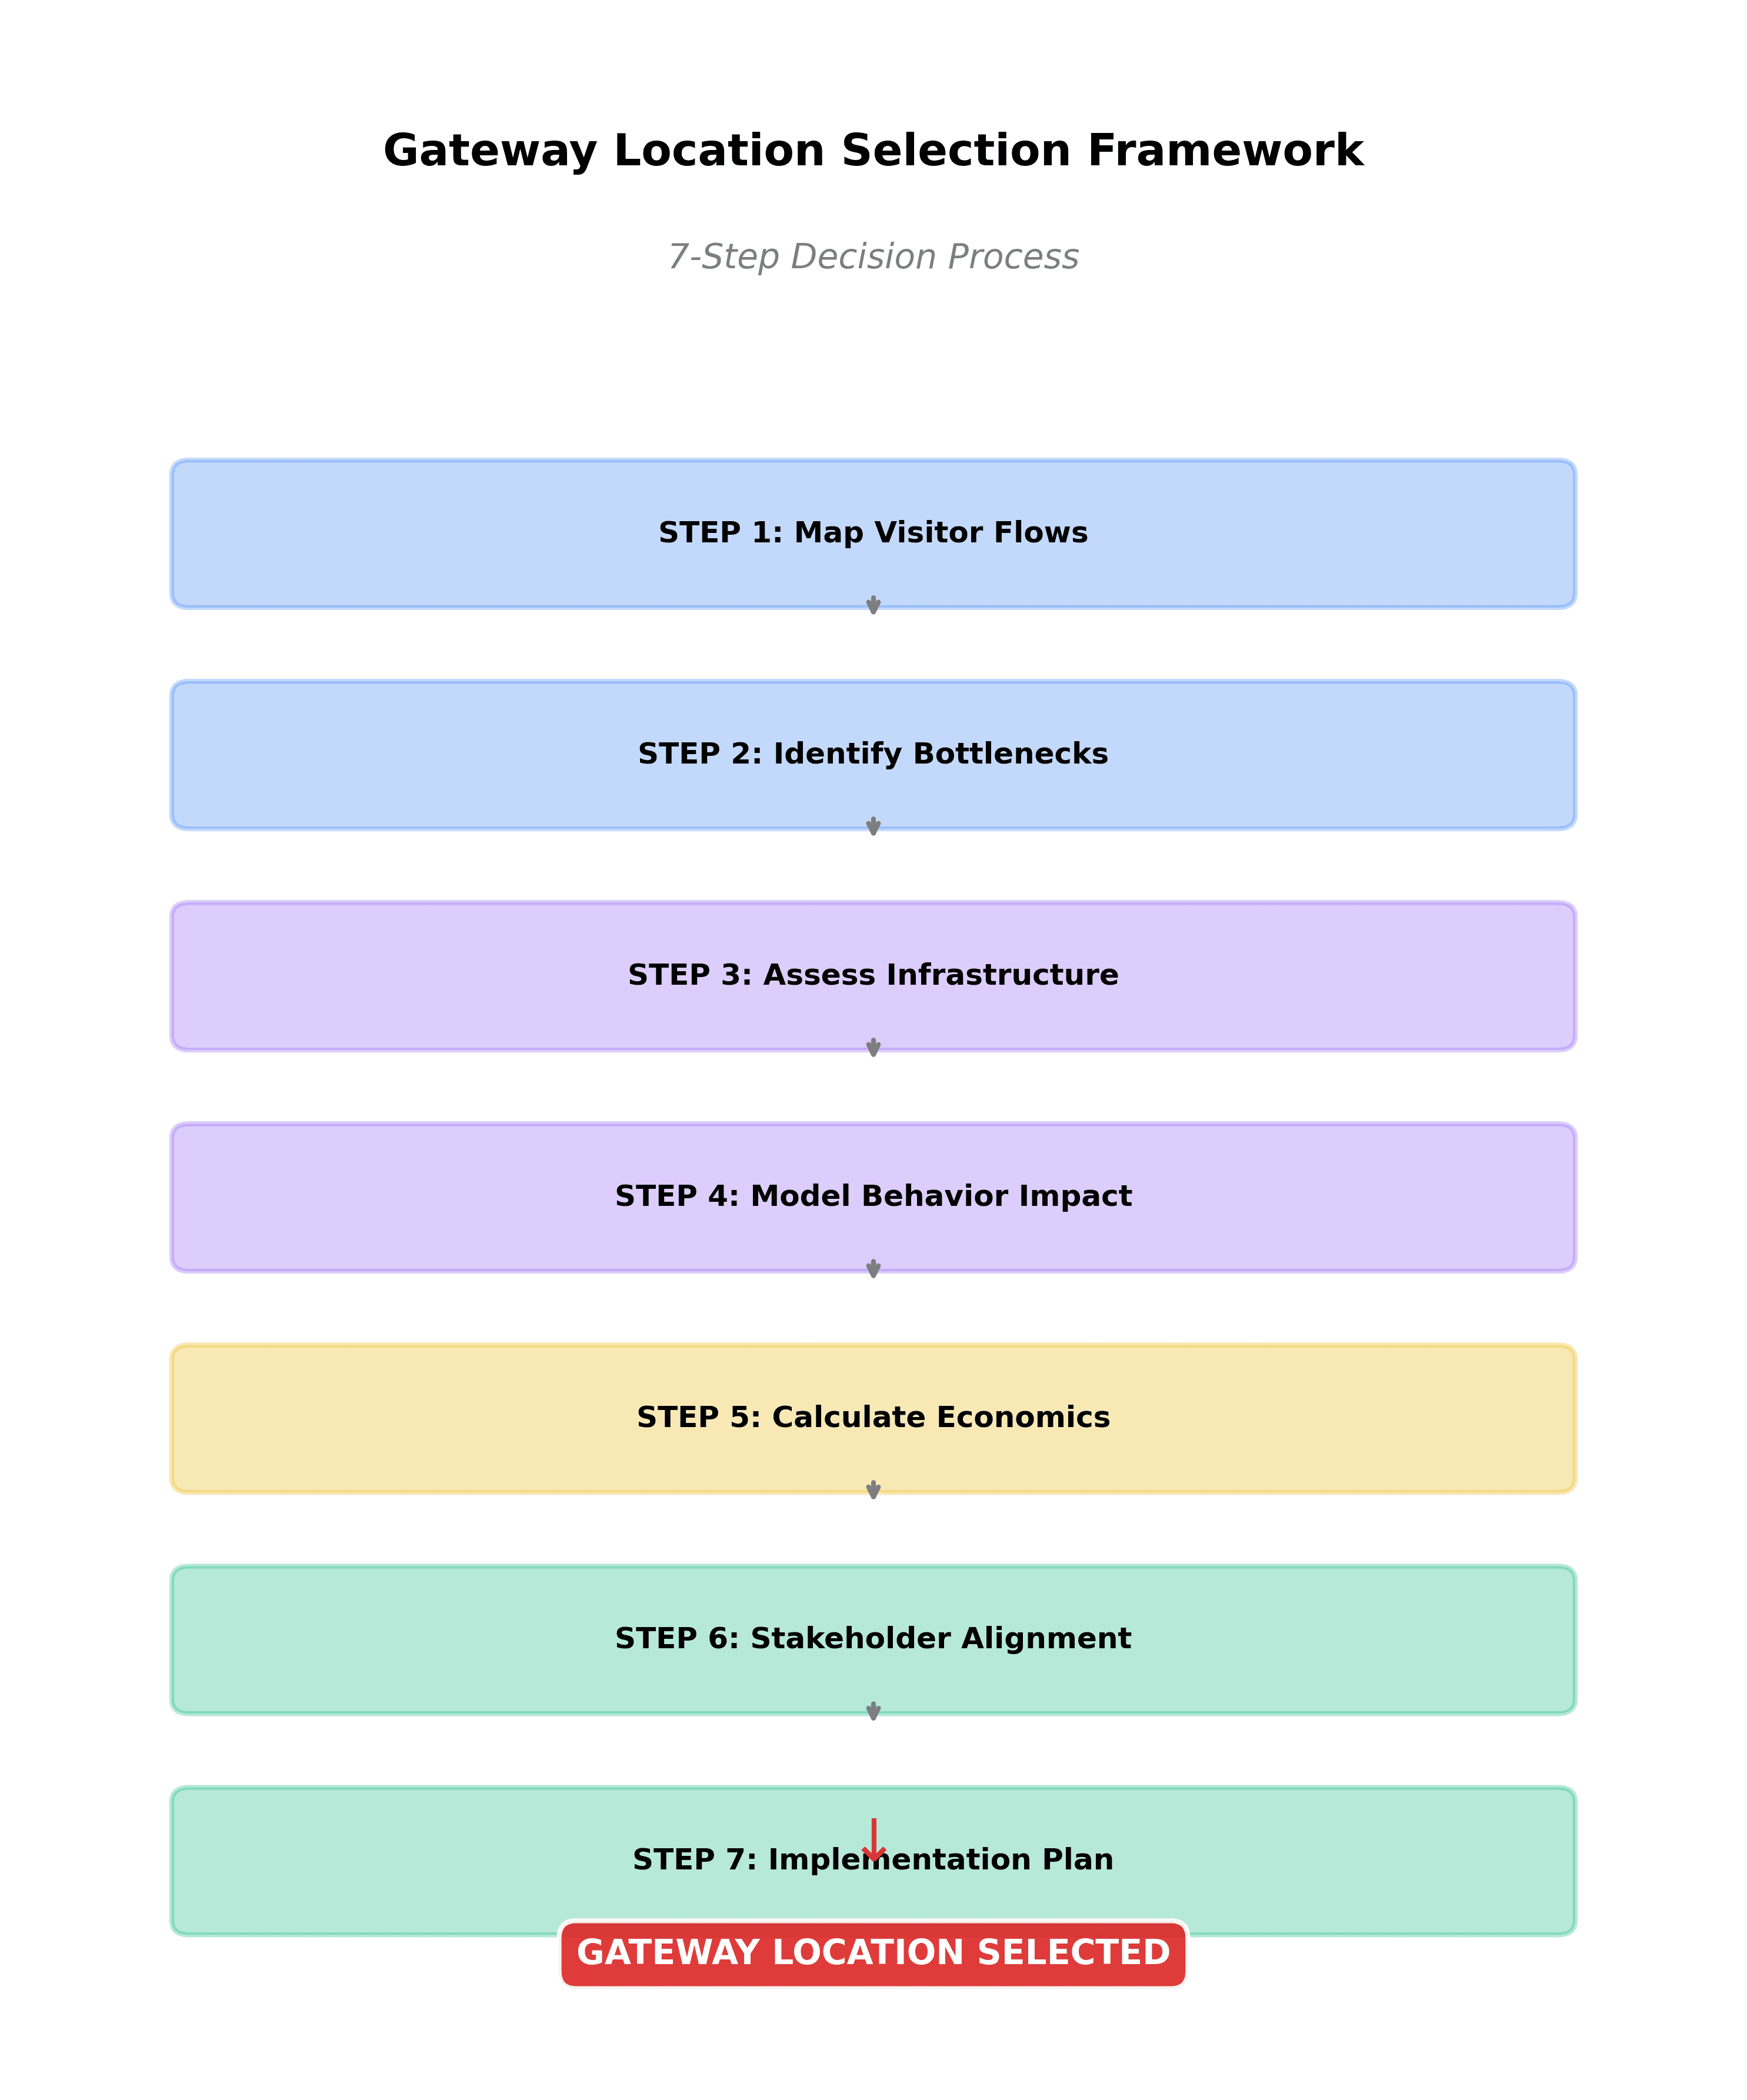
Visual overview of the seven-step gateway location selection process. The framework moves from data analysis (blue) through infrastructure assessment (purple) and financial modeling (yellow) to stakeholder alignment and implementation planning (green). Each step builds on the previous, creating a systematic pathway from destination profiling to investment-ready gateway proposals.
Most destination managers cannot finance, permit and construct multiple gateways simultaneously. Prioritise locations and sequence implementation.
Prioritisation criteria:
Impact potential: Which location addresses the most critical pressure point?
Financial strength: Which location has clearest path to financial sustainability?
Implementation speed: Which location has fewest regulatory or construction barriers?
Stakeholder readiness: Where is there strongest institutional support?
Demonstration value: Which location will be most visible to other destinations and investors?
Typical phased approach:
Phase 1 – Flagship gateway (Year 1):
Select single highest-impact, most feasible location
Secure public-private partnership or impact investment
Complete detailed design and content production
Launch with significant destination marketing integration
Phase 2 – Network expansion (Year 2-3):
Add 1–2 secondary gateways at other concentration points
Leverage content across venues (production amortisation)
Build operational expertise and refine business model
Phase 3 – System integration (Year 3-5):
Integrate gateways into dynamic visitor management system
Link to real-time flow monitoring and capacity alerts
Expand content library and refresh cycle
Develop replication model for other destinations
Risk management: Identify dependencies (funding cycles, permit approvals, content production timelines) and mitigation strategies. Build contingency into schedules and budgets.
Output: Multi-year implementation roadmap with milestones, budgets and responsible parties
Case application: Selecting gateway locations in a marine protected area
This framework can be illustrated through a composite case based on island and coastal destinations with high marine biodiversity and overtourism pressure.
Destination profile:
Archipelago with 90%+ protected marine area
250,000 annual visitors, 70% via ferry, 30% via regional flights
Key attractions: dive sites, nesting beaches, coastal trails
Documented coral stress and turtle nesting disruption
Strong regulatory framework but limited enforcement capacity
Step 1 – Flow mapping: Visitor flows converge through: main ferry port (175,000/year), regional airport (75,000/year), and three secondary boat launch points (combined 50,000/year for dive operators). Peak months show 3x average daily volumes.
Step 2 – Bottleneck identification:
Primary bottleneck: Ferry terminal with mandatory 45-minute pre-boarding waiting area
Secondary bottleneck: Airport arrival hall with tourist information desk
Tertiary points: Dive centre departure lounges (diffuse, lower volumes)
Step 3 – Infrastructure assessment:
Ferry terminal: Underutilised waiting hall (300 m²), adequate power, port authority controls access, moderate renovation required
Airport: Limited expansion space, complex air-side vs land-side permitting, higher construction cost
Dive centres: Private ownership, variable quality, difficult to standardise
Step 4 – Behavioural modelling: Priority behaviours: Reduce physical dive pressure on most vulnerable reefs, improve snorkelling etiquette around turtles, redirect some visitors to land-based trails. Ferry terminal gateway can serve 95% of visitors before any boat departure to dive sites or beaches.
Step 5 – Financial modelling: Ferry terminal scenario: 175,000 annual visitors, 20-minute shows, 70% participation rate, €12 bundled into ferry ticket. Projected €1.5M gross revenue, €450K operating costs. Capital requirement €1.2M. Payback <12 months.
Step 6 – Stakeholder alignment: Ferry operator sees value in differentiated service and reduced onboard crowding. Marine park authority supports pre-visit education tied to dive permits. Tourism board wants destination brand enhancement. Local dive operators initially concerned about revenue capture – addressed through co-branded content featuring their sites and partnership discount structures.
Step 7 – Implementation roadmap:
Year 1: Ferry terminal flagship gateway, content featuring marine ecosystems and turtle nesting
Year 2: Add airport arrival gateway with shorter (10-minute) welcome experience
Year 3: License content to feeder city aquariums and maritime museums (visitor preparation before arrival)
Outcome: Prioritised, financially viable, stakeholder-aligned gateway strategy with clear implementation path.
Integration with broader destination management systems
Immersive gateways are most effective when integrated into comprehensive destination management frameworks rather than deployed as isolated attractions.
Digital integration opportunities:
Pre-arrival visitor management:
Link gateway show reservations to booking and ticketing systems
Use gateway participation as condition for limited-capacity site permits
Integrate with mobile apps providing post-visit behavioural nudges
Real-time flow management:
Adjust gateway show content based on current site congestion (e.g., promote alternative sites)
Coordinate show schedules with ferry or shuttle departures
Use gateway throughput data to forecast site pressure
Impact monitoring:
Survey visitors before and after gateway experience to measure behavioural intention changes
Track compliance with site rules (marked trails, wildlife distances) via ranger observation
Monitor ecosystem indicators (coral health, beach erosion, wildlife stress) and correlate with visitor behaviour patterns
The World Bank's Destination Management Handbook emphasises that effective destination management depends on good intelligence systems: understanding who visits, where pressure builds and how local economies depend on tourism (World Bank DMO Handbook). Immersive gateways generate valuable data while also serving as intervention points.
Policy and planning integration:
Embed gateway development in destination master plans
Align gateway placement with zoning and carrying capacity frameworks
Use gateway revenue to fund conservation and community benefit schemes
Position gateways as tourism impact mitigation infrastructure in environmental assessments
Destinations can present gateway investments as capital solutions to carrying capacity challenges – demonstrating to residents, investors and regulators that growth is being managed responsibly.
Common gateway location mistakes and how to avoid them
Mistake 1: Placing gateways inside destinations rather than at entry points
Problem: Visitors have already formed behavioural patterns and experienced sensitive sites before encountering interpretation.
Solution: Prioritise locations where visitors pass before reaching pressure zones. If mid-destination placement is unavoidable, focus on secondary gateways that redirect flows for multi-day visitors.
Mistake 2: Selecting sites based on available real estate rather than visitor flows
Problem: Low-cost sites with minimal traffic produce poor ROI and fail to reach critical mass of visitors.
Solution: Always start with flow analysis. Infrastructure costs can be optimised later; wrong locations cannot be fixed by better content.
Mistake 3: Underestimating regulatory and community engagement timelines
Problem: Projects stall in permitting, face community opposition or create unintended conflicts with existing operators.
Solution: Begin stakeholder engagement before site selection. Frame gateways as collaborative infrastructure that benefits multiple parties rather than DMO-controlled attractions.
Mistake 4: Over-designing for local uniqueness at the expense of operational efficiency
Problem: Completely custom infrastructure and content inflate budgets and create vendor lock-in, making scaling impossible.
Solution: Use modular, proven technology platforms. Invest creative resources in content and local storytelling, not reinventing projection domes or seating systems.
Mistake 5: Treating gateways as standalone attractions rather than system components
Problem: Gateways compete with other destination offerings instead of supporting them, causing operator resistance.
Solution: Design gateways as preparation and amplification for the real destination. Feature local tour operators, accommodations and experiences in content. Structure revenue sharing to align incentives.
Funding and partnership models for gateway development
Immersive gateways cross the boundary between tourism infrastructure and conservation intervention, creating opportunities for blended finance.
Public funding sources:
National or regional tourism development grants
Protected area visitor facility budgets
Port authority infrastructure funds
Climate adaptation and resilience programmes
EU or development bank destination competitiveness schemes
Private investment structures:
Public-private partnerships (PPP) with revenue-sharing
Impact investment funds focused on sustainable tourism (Immersive Investors dataset maps 45 investors, with approximately one third explicitly focused on impact)
Tourism operator consortia (ferry companies, cruise lines, hotel groups)
Real estate and resort developers seeking destination amenities
Philanthropic and conservation finance:
Conservation NGOs supporting visitor education infrastructure
Foundation grants for marine or heritage protection
Corporate sustainability partnerships (especially maritime, travel or technology sectors)
Crowd-funding or community bonds for locally-supported projects
Revenue and ownership structures:
Operating concession model:
Public authority retains land ownership and policy control
Private operator builds and manages gateway under long-term concession (15–25 years)
Revenue split or minimum guarantee payments to public authority
Performance tied to behavioural outcomes (visitor education effectiveness)
Joint venture model:
Public-private co-investment in capital
Shared governance and operational responsibility
Revenue split based on investment shares
Aligned incentives for financial and conservation outcomes
Transport operator integration:
Ferry or cruise company finances gateway as value-add to core service
Gateway experience bundled into transport ticket
Brand differentiation and enhanced passenger experience
Lower standalone investment risk through existing customer flow
Destination managers should explore partnership opportunities with Origin of Wonder, which offers turnkey gateway solutions with flexible finance and partnership structures tailored to destination contexts (explore partnership opportunities).
Data resources for gateway location analysis
Effective gateway placement requires systematic data collection and analysis. The following open datasets provide foundation resources for destination profiling and investor mapping.
Immersive Destination Analysis dataset Profiles 88 tourism and investment destinations in the Global South, combining visitor flows, attraction characteristics, sustainability pressure indicators and protected area data.
Immersive-destination-marketing dataset Underlying dataset with detailed destination and attraction profiles, including visitor estimates, protected area ratios and tourism dependency categories.
Immersive Investors dataset Maps 45 investors and related entities active in immersive infrastructure, tourism, culture and conservation, with focus on impact-oriented capital pools.
Immersive Keywords dataset Long-term news analysis tracking the rise of "immersive storytelling" and related terms as measurable media trend.
These datasets are maintained as open resources for destination managers, researchers and investors to support evidence-based decision-making in sustainable tourism infrastructure.
Frequently Asked Questions
What is an immersive gateway?
An immersive gateway is a purpose-designed venue – typically a fulldome theatre, mixed-reality gallery or flying theatre – placed at a destination entry point to prepare visitors before they access sensitive sites. The gateway delivers short (15–35 minute) high-impact experiences that build emotional connection to place, explain ecological or cultural significance and set behavioural expectations. Unlike traditional visitor centres with passive displays, immersive gateways use spatial storytelling to make complex systems intuitive and memorable.
Research on environmental interpretation shows that well-designed pre-visit experiences measurably change visitor behaviour in protected areas, improving compliance with rules and reducing ecological impacts (USGS review, interpretation effectiveness study).
Where should immersive gateways be located?
Gateways should be placed at structural bottlenecks where visitor flows naturally concentrate before dispersing to sensitive destinations. Priority locations include ferry terminals, airport arrival areas, cruise embarkation zones, park headquarters and shuttle departure points. The location must satisfy three criteria: high visitor throughput (typically 150,000+ annually for financial sustainability), timing before sensitive site access, and infrastructure readiness for immersive installations.
Analysis of 88 destinations shows that protected and overtourism-affected destinations often have underutilised spaces at these concentration points that can host gateways without major new construction (Immersive Destination Analysis).
How much does a gateway cost and what are typical returns?
Capital costs for fulldome gateways range from $800,000 to $1.5 million depending on site conditions, dome size (12–20m diameter typical) and content production. Operating costs run 25–35% of gross revenue. High-throughput locations (300,000+ annual visitors) with $10–12 average ticket prices generate $600,000–1,000,000 annual gross revenue, producing 12–24 month payback periods.
Financial sustainability depends on location selection and integration with existing visitor flows. Gateways bundled into ferry tickets or shuttle packages achieve higher participation rates than standalone ticketed attractions. The Origins of Wonder impact investment analysis documents unit economics showing 67% EBITDA margins for well-sited installations.
Do immersive gateways actually change visitor behaviour?
Systematic reviews of visitor education programmes in protected areas show that well-designed interpretation can measurably reduce environmental impacts when it: (1) occurs before site access, (2) connects to visitor values rather than presenting generic rules, (3) uses emotionally engaging formats, and (4) makes desired behaviours feel intuitive (USGS low-impact education review, values-based interpretation study).
Immersive formats amplify these effects. Studies on immersive tourism experiences indicate that deeply designed spatial environments increase visitor engagement and support more sustainable behaviour choices when properly framed (immersive tourism sustainability research, AR heritage sustainability study).
Destinations should establish baseline metrics (e.g., percentage of visitors staying on marked trails, wildlife distance compliance, dwell time at sensitive spots) and track changes after gateway implementation.
How do gateways integrate with existing destination management?
Immersive gateways are most effective as components of comprehensive destination management systems rather than standalone attractions. Integration opportunities include:
Booking and permitting systems: Link gateway participation to limited-capacity site permits
Transport coordination: Synchronise show schedules with ferry or shuttle departures
Real-time flow management: Adjust gateway content to promote less-congested alternative sites
Impact monitoring: Survey visitors before/after gateway experience to measure behavioural changes
Revenue allocation: Direct gateway ticket revenue to conservation funds, ranger salaries or community benefit schemes
The World Bank's Destination Management Handbook emphasises that effective destination management depends on integrated planning, stakeholder coordination and good intelligence systems – all capabilities that gateway infrastructure can support (World Bank DMO Handbook).
What stakeholders need to be involved in gateway development?
Gateway projects typically span multiple jurisdictions and interest groups. Key stakeholders include:
Public sector: Destination marketing organisations (DMOs), protected area management authorities, municipal planning departments, environmental agencies, transport and port authorities
Private sector: Ferry and cruise operators, resort and hotel associations, tour operators, local business chambers
Community and civil society: Resident associations, indigenous or traditional landowner groups, conservation NGOs, cultural heritage organisations
International guidelines emphasise multi-stakeholder governance in destination management, where tourism businesses, authorities and communities co-design strategies (UNWTO DMO strengthening guidelines). Early consultation and transparent partnership structures reduce conflicts and accelerate implementation.
How long does it take to develop and launch a gateway?
Timeline depends on site complexity, regulatory environment and stakeholder readiness. Typical phases:
Planning and approvals (3–6 months):
Site selection and feasibility assessment
Stakeholder consultation
Regulatory approvals and permits
Design and production (4–8 months):
Infrastructure design and engineering
Content creation and production
Technology procurement and integration
Construction and installation (3–6 months):
Site preparation and renovation
Dome installation and fit-out
AV system integration and testing
Launch and optimisation (2–3 months):
Staff training and operational testing
Soft opening and refinement
Marketing launch and integration with booking systems
Total timeline: 12–24 months from initial planning to full operation. Destinations with strong institutional capacity, clear stakeholder alignment and existing infrastructure at gateway sites can compress timelines.
Can gateway content be updated or expanded over time?
Content flexibility is a core advantage of immersive gateway infrastructure. Unlike fixed museum exhibits or permanent installations, gateway content can be updated without modifying physical infrastructure.
Content evolution strategies:
Seasonal rotation: Alternate between 3–5 storylines (nesting season focus, coral spawning, migration patterns)
Thematic updates: Add new content responding to emerging research, climate impacts or conservation priorities
Partnership content: Feature different tour operators, accommodations or regional experiences in rotation
Multi-generational refresh: Major content overhauls every 3–5 years as production technology advances
This modularity allows destinations to amortise content production costs across multiple venues and to respond dynamically to changing conditions – a critical advantage given climate uncertainty and evolving visitor expectations.
What happens if visitor numbers decline or change seasonally?
Gateway financial models should be stress-tested for volume sensitivity. Mitigation strategies for demand volatility:
Revenue diversification:
Serve both tourists and local residents (school groups, community events)
License content to other venues for recurring income
Host private events and corporate functions during low season
Develop mobile or pop-up versions for off-site deployment
Operational flexibility:
Variable show schedules: more frequent in peak season, reduced in shoulder periods
Dynamic pricing to smooth demand across days and seasons
Staff flexibility: seasonal contracts supplementing core team
Content that appeals to repeat visitors (locals become repeat customers)
Partnership structures:
Minimum guarantee agreements with ferry or cruise operators
Revenue-sharing with transport and accommodation sectors that benefit from gateway value-add
Public subsidy for conservation education function during low-occupancy periods
Destinations with extreme seasonality may use gateways as year-round community assets – marine education centres, event venues, local heritage museums – that happen to serve tourists in peak months rather than single-purpose tourist attractions idle in low season.
How do Origin of Wonder partnerships work?
Origin of Wonder develops immersive gateway projects in partnership with destination authorities, protected area managers, transport operators and impact investors. Partnership structures are flexible and adapted to local contexts, institutional capacity and available capital.
Typical partnership models:
Turnkey development: Origin of Wonder leads site selection, design, content production, technology integration and launch, then transfers to local operation or continues with management contract.
Co-development: Joint planning and implementation with destination authority or transport operator, combining Origin of Wonder's technical expertise with local knowledge and stakeholder relationships.
Licensing and technical assistance: Origin of Wonder provides content, technology platform and operational guidance while destination entity owns and operates gateway infrastructure.
Investment facilitation: Origin of Wonder connects destinations with impact investors from the Immersive Investors network, structuring blended public-private finance for gateway development.
Destination managers interested in exploring gateway opportunities can request a feasibility assessment or schedule a consultation to discuss specific destination contexts and partnership options.
Taking action: From framework to implementation
Gateway location selection is the foundation of effective immersive destination infrastructure. The seven-step framework presented here provides a systematic approach to identifying high-impact locations, ensuring financial sustainability and aligning with destination management objectives.
Immediate next steps for destination managers:
Assess current state: Map visitor flows, pressure points and existing infrastructure using the Step 1–2 methodology
Access data resources: Explore the Immersive Destination Analysis dataset to benchmark your destination against global patterns
Engage stakeholders: Begin preliminary conversations with protected area managers, transport operators and DMO leadership using the stakeholder mapping tools in Step 6
Request feasibility assessment: Work with Origin of Wonder to apply this framework to your specific destination context and develop investment-ready gateway proposals (request assessment)
The global overtourism crisis creates both urgency and opportunity. Destinations that act now to develop strategic gateway infrastructure will be positioned to manage visitor pressure while maintaining competitiveness and community support. Those that delay will find themselves increasingly constrained by carrying capacity limits, resident pushback and ecosystem degradation.
Immersive gateways are not experimental add-ons – they are becoming essential infrastructure for destinations serious about long-term sustainability. The question is not whether to develop gateways, but where to place them for maximum impact.
For deeper context on the investor landscape, unit economics and evidence base supporting immersive gateway investments, see the comprehensive analysis: Origins of Wonder: An Immersive Impact Investment.
For assistance applying this framework to your destination, request a feasibility assessment or schedule a consultation.
About the author: This framework draws on systematic destination profiling across 88 locations, field assessments in marine protected areas and UNESCO heritage sites, and structured analysis of immersive infrastructure investments. The author (Martim Sambauer) works with Origin of Wonder to develop data-driven gateway solutions for destinations under pressure.
Data availability: All datasets referenced in this article are openly available on GitHub with full methodology documentation. Destination managers are encouraged to fork, extend and apply these resources to their own contexts.
Contact Origin of Wonder:
Destination partnership enquiries: originsofwonder.com/destination-partnerships
Feasibility assessment requests: originsofwonder.com/feasibility-assessment
Technical consultations: originsofwonder.com/contact