Immersive Tourism Infrastructure: The Emerging Asset Class for Impact Investors
Nov 21, 2025

Immersive Tourism Infrastructure: The Emerging Asset Class for Impact Investors
Why experienced infrastructure investors are allocating to immersive gateways
Impact investors seeking exposure to sustainable tourism face a persistent challenge: most interventions require accepting below-market returns or sacrificing scale. Ecotourism lodges deliver strong impact but limited capital deployment capacity. Certification programmes influence behaviour but generate minimal financial returns. Traditional tourism infrastructure – hotels, resorts, transport – scales efficiently but often worsens environmental and social outcomes.
Immersive tourism infrastructure represents a structural exception to this trade-off. Analysis of 45 investors and related entities in the immersive space reveals that approximately one-third now position themselves explicitly as impact funds, development finance institutions or hybrid vehicles with sustainability mandates (Immersive Investors dataset, raw JSON, methodology). Several consistently highlight ocean and coastal conservation agendas, blue economy themes and community benefit frameworks in their investment criteria.
This convergence reflects underlying economics that align financial performance with impact delivery. Immersive gateway venues – fulldome theatres, flying theatres and mixed-reality galleries placed at high-traffic tourism entry points – generate cash flows comparable to conventional entertainment infrastructure while measurably reducing physical destination pressure. Unit economics show 67% EBITDA margins with 12-24 month capital payback periods in high-throughput locations, creating investment profiles that satisfy both commercial return requirements and rigorous impact standards.
The asset class remains early-stage, with most capital concentrated in large-scale mixed-use developments rather than purpose-built conservation gateways. This creates first-mover advantages for investors willing to deploy capital into systematic gateway rollouts across overtourism destinations, protected marine areas and heritage sites where conventional tourism infrastructure faces regulatory constraints or community opposition.
This article examines the investment thesis for immersive tourism infrastructure through systematic analysis of unit economics, risk factors, impact measurement frameworks and portfolio construction strategies. For destination-facing operational context, see the companion analysis: Origins of Wonder: An Immersive Impact Investment.
The investment thesis: Repeatable assets in constrained destinations
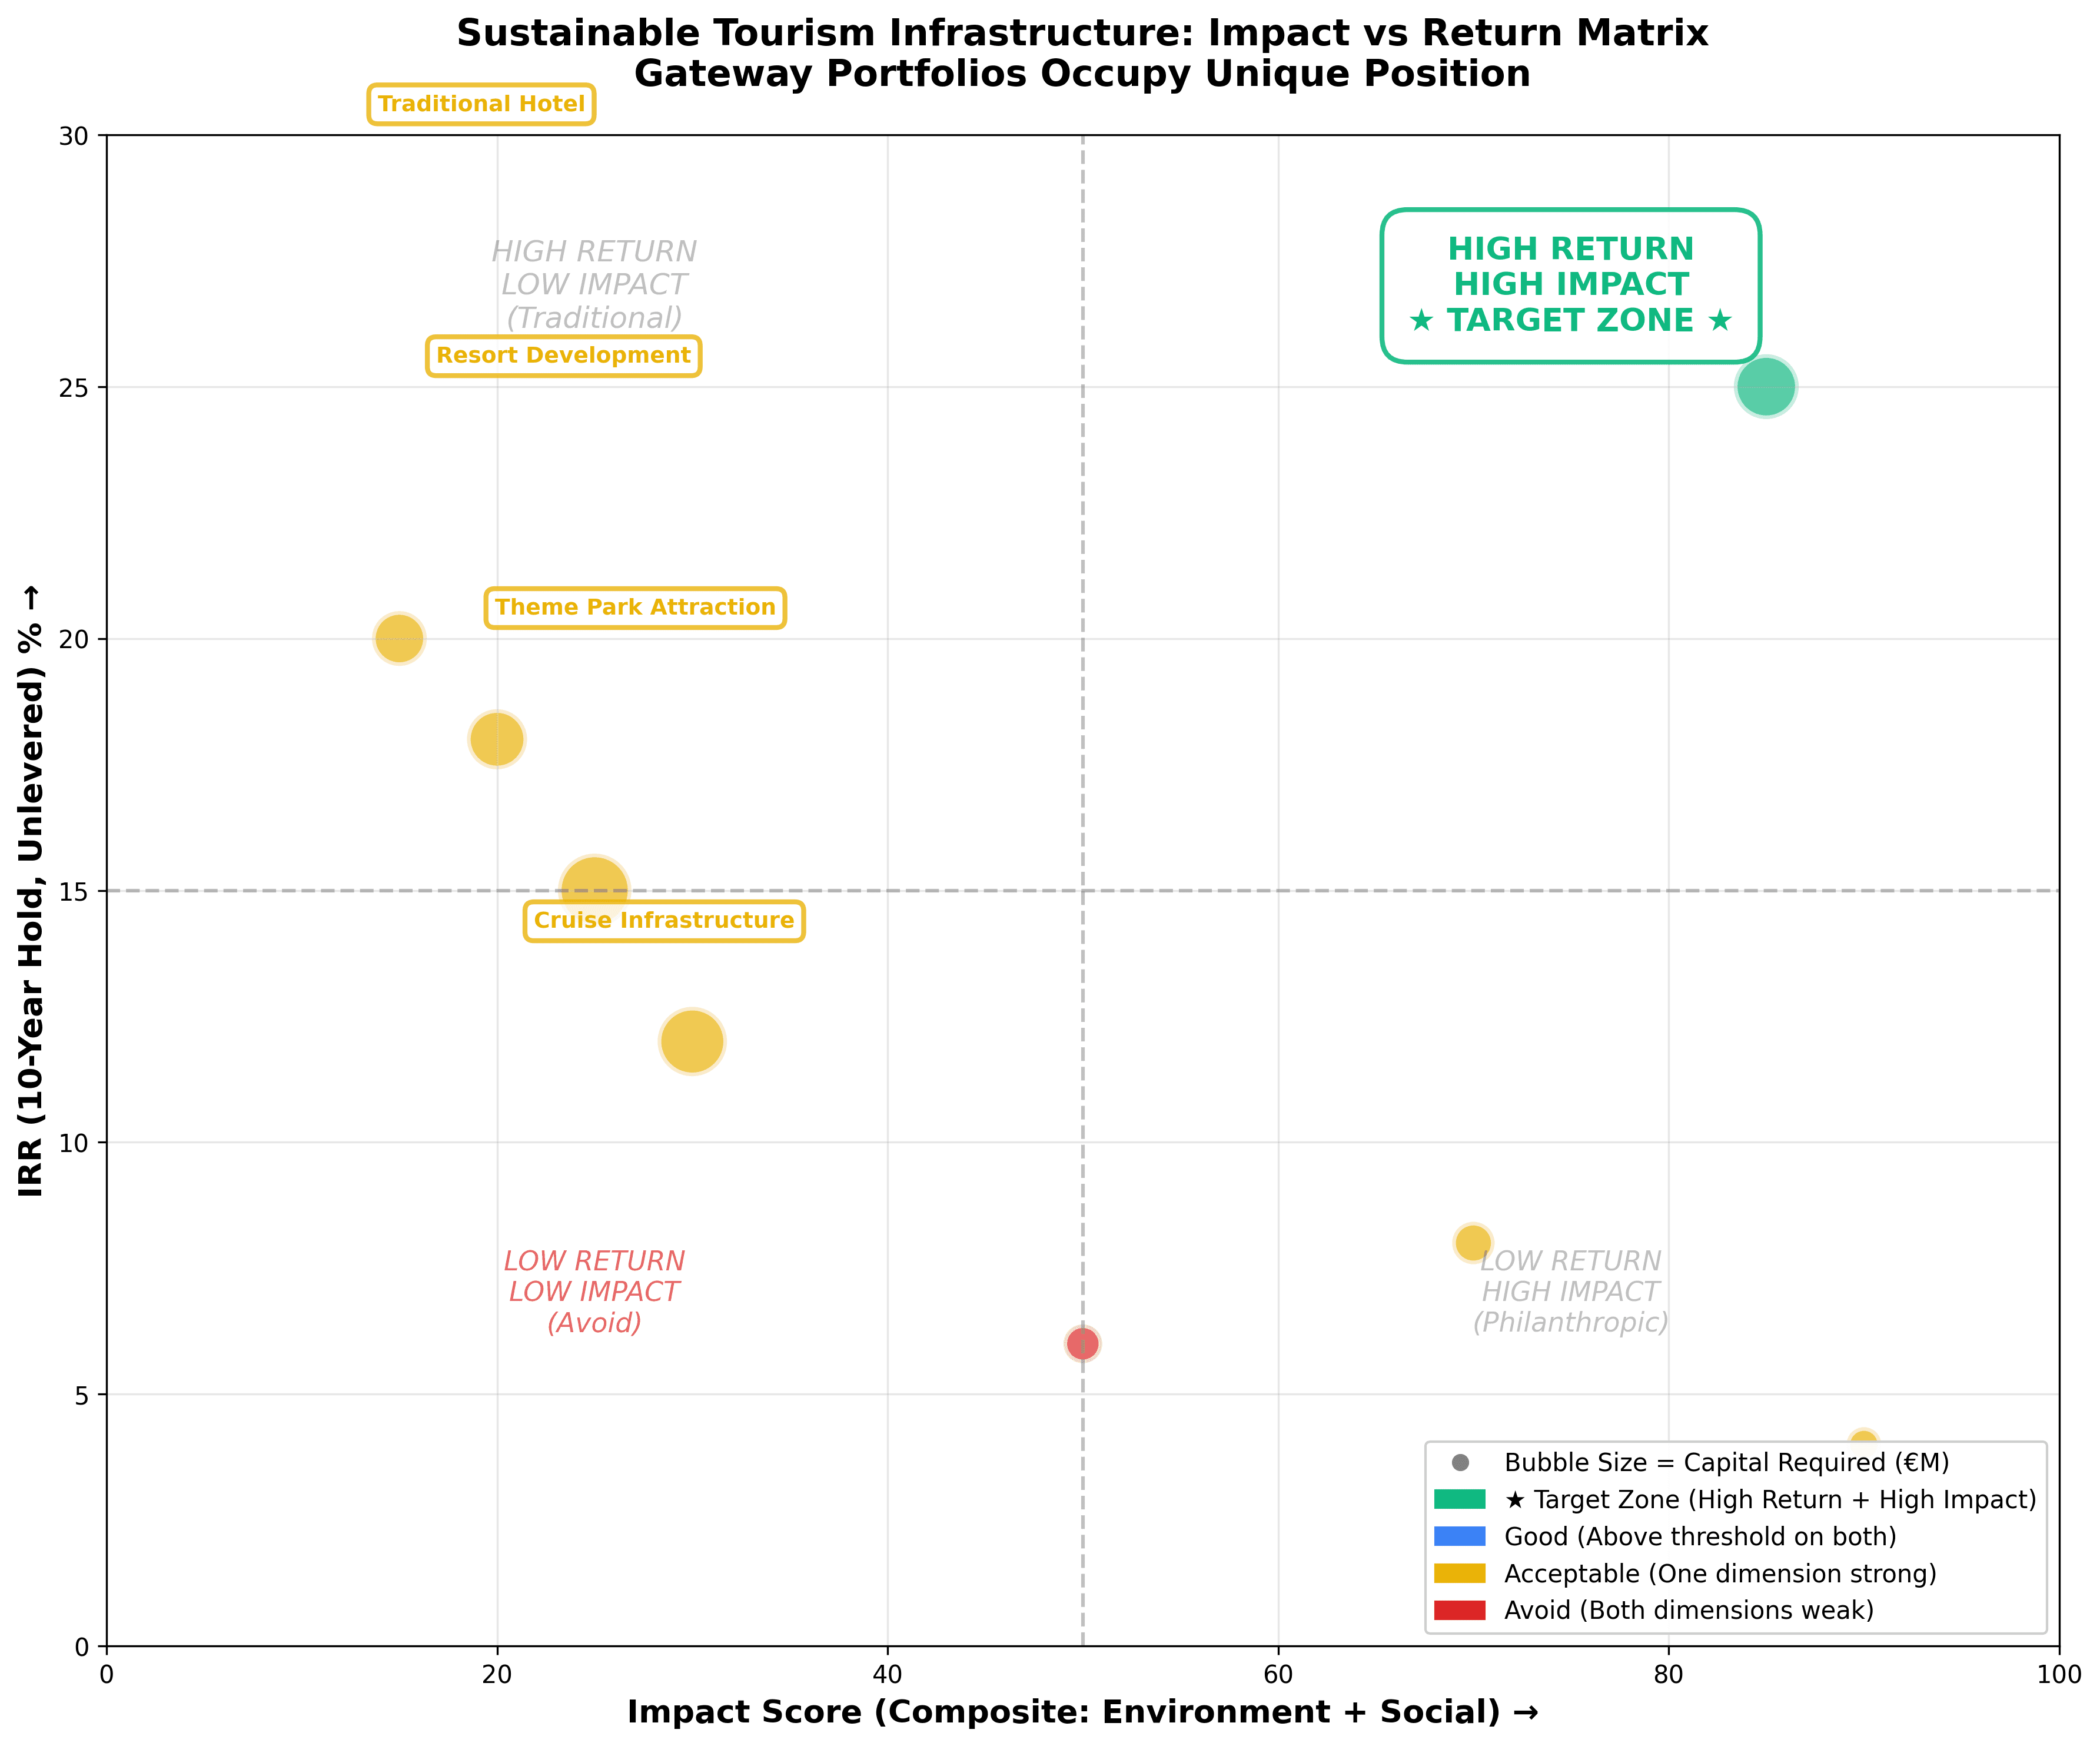
Gateway portfolios occupy unique position delivering both high financial returns (25% IRR) and high impact scores (85/100 composite). Traditional hotels generate similar returns (12-15% IRR) but minimal impact (30/100). Eco-lodges deliver strong impact (70/100) but subdued returns (8% IRR). Conservation finance maximizes impact (90/100) but offers below-market returns (4% IRR). Gateways represent rare alignment: commercial-grade returns with institutional-quality impact credentials. Bubble size indicates capital intensity; gateway portfolios deploy moderate capital (€15-40M) achieving superior risk-adjusted returns versus large resort developments or theme park infrastructure.
Immersive infrastructure investments satisfy three criteria that define compelling asset classes: predictable cash flows, operational scalability and structural demand tailwinds.
Predictable cash flows from captive visitor streams
Gateway locations – ferry terminals, cruise ports, airport arrival areas, national park entrances – concentrate visitor flows through controlled access points. Unlike hotels competing for market share or attractions dependent on discretionary visits, gateways capture near-mandatory throughput from visitors already committed to destination travel.
A ferry terminal serving 300,000 annual passengers to an island destination processes every arriving visitor through a single infrastructure node. Bundling gateway tickets into ferry fares or positioning the experience as premium shore excursion content creates participation rates of 40-70%, compared to 5-15% conversion typical for optional attractions. This captive audience dynamic produces revenue predictability comparable to transport infrastructure rather than discretionary leisure spending.
Reference case: Island ferry terminal gateway
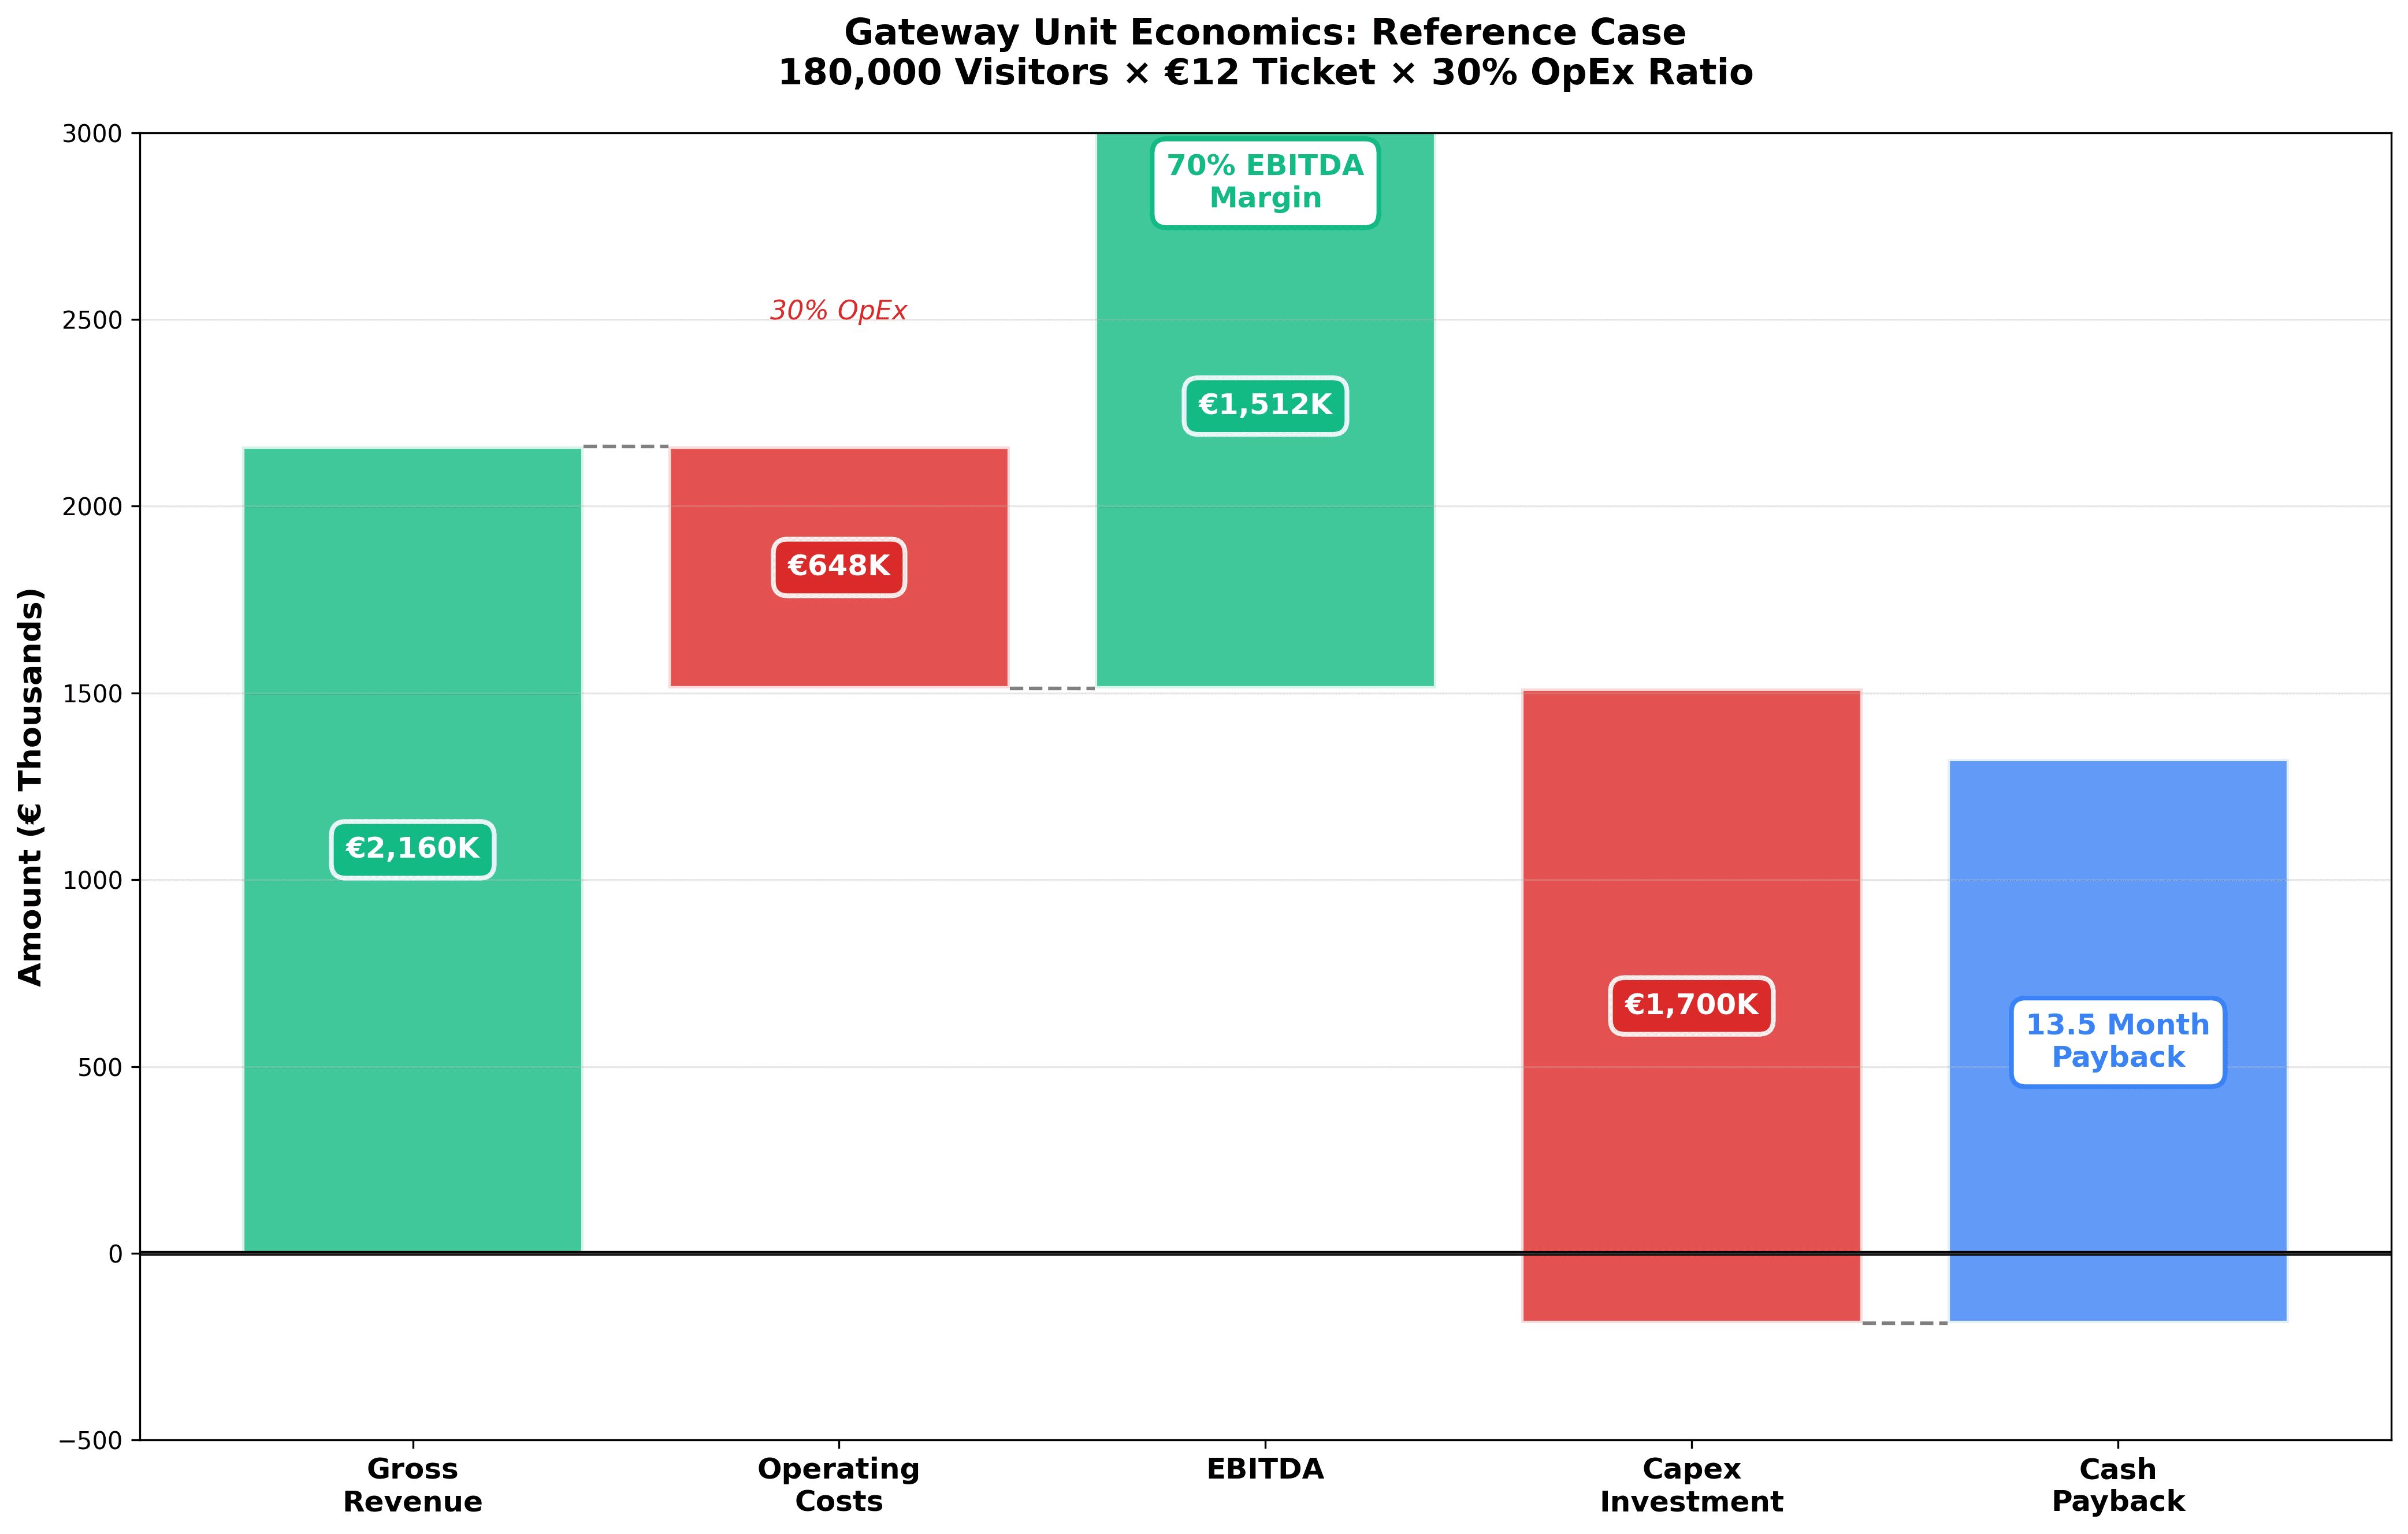
Unit economics waterfall for reference island ferry terminal gateway: 180,000 annual visitors at €12 average ticket generate €2.16M gross revenue. Operating costs of 30% (€648K) yield €1.51M EBITDA (70% margin). Against €1.7M capex investment, simple payback period: 13.5 months. Based on conservative participation rates and pricing assumptions.
Assumptions |
|---|
Annual ferry passengers: 300,000
|
Annual metrics |
Visitors served: 180,000
|
Capital deployment: |
Infrastructure (dome, seating, facilities): €900,000
|
Return metrics: |
Simple payback: 13.5 months
|
These projections assume conservative participation rates and pricing. Premium positioning (€15-18 tickets for cruise passengers), ancillary revenue (merchandise, food service, event space rental) and content licensing to additional venues can enhance returns materially.
Operational scalability through technology standardisation
Unlike hospitality assets requiring site-specific design and ongoing service delivery, immersive infrastructure separates standardised technology platforms from customised content. A 16-metre fulldome projection system operates identically whether installed in Santorini, the Galápagos or the Maldives. Operational procedures – show scheduling, ticketing integration, maintenance protocols – replicate across venues with minimal localisation.
Content creation represents the primary customisation cost, but production investment amortises across multiple deployment scenarios:
Content economics:
Initial production (20-minute immersive show): €100,000-150,000
Filming, post-production, audio design, localisation
Licensing to 5-10 venues: €15,000-30,000 per venue in licensing revenue
Refresh cycle: 3-5 years (periodic updates maintain novelty without full reproduction)
This separation allows developers to achieve economies of scale unavailable to traditional tourism infrastructure. A hotel operator building properties across destinations faces site-specific construction, variable labour markets and non-transferable operational systems. Gateway developers deploy proven technology, leverage shared content libraries and operate venues with lean teams (typically 4-6 FTE per location).
Scaling trajectory:
Venue 1-3 (Proof of concept): 18-24 months per venue, full custom development
Venue 4-10 (Replication): 12-15 months per venue, 30% cost reduction through standardisation
Venue 10+ (Portfolio): Concurrent development, shared content library, centralised procurement driving 40-50% efficiency gains versus standalone projects
Structural demand from overtourism and conservation finance
Destinations facing visitor pressure that exceeds ecological or social carrying capacity represent a $250+ billion addressable market experiencing structural growth rather than cyclical variation. UN Tourism documentation shows overtourism affects destinations across all continents, with symptoms intensifying despite periodic economic downturns (UNWTO overtourism framework).
Analysis of 88 destinations in the Global South reveals that approximately 37% display explicit overtourism signals, with pressure concentrated at small numbers of iconic sites. Among attractions flagged for high sustainability pressure, 86% lie inside protected or heritage areas (Immersive Destination Analysis dataset, detailed methodology).
This creates pull demand from three capital sources:
1. Public tourism development funds: Destination authorities allocate €50-500 million annually (depending on destination scale) to infrastructure that enhances competitiveness while managing impacts. Gateway proposals compete favourably against conventional visitor centres, transport upgrades or marketing campaigns because they deliver measurable pressure reduction alongside revenue generation.
2. Conservation and climate finance: Philanthropic capital and development banks seeking scalable conservation interventions increasingly recognise that tourism pressure threatens protected areas more acutely than extractive industries in many contexts. Gateway infrastructure that demonstrably reduces physical site impacts qualifies for conservation finance that conventional tourism assets cannot access. Current estimates suggest $5-8 billion in annual conservation funding flows to tourism-related interventions, with growing interest in infrastructure solutions versus programme-based approaches.
3. Private impact investment: The Immersive Investors dataset maps 45 entities with approximately one-third explicitly targeting impact alongside returns. Many focus on ocean conservation, island destinations and community-based tourism – natural alignments with gateway investment theses. As ESG mandates tighten and impact measurement sophistication increases, capital allocation to infrastructure with credible dual-return profiles should accelerate.
Unlike discretionary leisure spending vulnerable to recession, conservation imperatives and resident backlash against tourism create non-cyclical pressure for solutions. Destinations cannot indefinitely defer action when UNESCO threatens heritage site delisting, residents mobilise politically or ecosystem collapse becomes visible. This produces counter-cyclical investment characteristics: gateway proposals often gain traction during periods when tourism growth slows and destinations face pressure to demonstrate sustainability commitments.
Unit economics deep dive: Revenue drivers and cost structure
Investors evaluating gateway opportunities require granular understanding of revenue composition, cost behaviour and sensitivity to operational variables.
Revenue composition and drivers
Primary revenue: Direct ticket sales
Ticket pricing varies by destination context, visitor demographics and competitive positioning:
Budget positioning | Mid-market positioning | Premium positioning |
|---|---|---|
Island destinations with price-sensitive domestic and regional visitors
| Heritage cities and national parks with mixed international/domestic audiences
| Cruise passenger shore excursions
|
Participation rates depend heavily on visitor flow integration:
Integrated scenarios | Promoted scenarios | Unmarketed scenarios (10-20% participation): |
|---|---|---|
Bundled into ferry tickets (opt-out rather than opt-in)
| Standalone ticket with prominent point-of-sale presence
| Minimal promotion, walk-up sales only
|
Ancillary revenue opportunities
Beyond ticket sales, well-operated gateways generate 15-30% additional revenue through:
Content licensing (€50,000-200,000 annual per show):
License immersive content to other venues (science centres, aquariums, planetariums in feeder markets)
Typical licensing fee: €10,000-25,000 per venue per year
One production licensed to 5-10 venues generates substantial recurring revenue
Particularly attractive for unique content (e.g., Galápagos endemic species, specific heritage sites)
Merchandise and educational products (€2-5 per visitor):
Books, media, locally-sourced products aligned with content themes
Typically 30-40% margins after COGS and retail labour
Works best when integrated into exit flow with compelling impulse purchase products
Food and beverage (€3-8 per visitor, where applicable):
Café or bar operations in waiting/post-show areas
Particularly relevant for venues with extended dwell times (airport gates, cruise terminals)
Requires additional labour and operational complexity; often outsourced to specialist operators
Event and corporate bookings (€500-3,000 per event):
Private screenings for corporate groups, conferences, educational institutions
Evening rentals when daytime tourism is low
Higher margins but unpredictable volume; typically 10-15% of total revenue
Sponsorship and partnerships (€20,000-100,000 annual):
Conservation organisations co-branding
Transport operators (ferry lines, airlines) as naming sponsors
Equipment manufacturers seeking showcase venues
Local businesses buying recognition in pre-show content
Operating cost structure
Operating expenses typically run 25-35% of gross revenue, varying by labour costs, energy prices and maintenance intensity.
Labour (45-55% of operating costs):
Show operators/projectionist: 2-3 FTE
Ticketing and guest services: 1-2 FTE
Maintenance technician: 0.5-1 FTE (shared across venues in portfolio context)
Management/administration: 0.5 FTE (centralised for multi-venue operations)
Total: 4-6 FTE per venue, with salary levels reflecting local markets (€25,000-45,000 annual average burden)
Content and technology (20-30% of operating costs):
Software licensing and updates: €15,000-25,000 annual
Projector lamp replacement: €5,000-10,000 annual (LED systems reduce this)
Audio system maintenance: €3,000-5,000 annual
Content refresh and seasonal updates: €20,000-40,000 annual (amortised production costs)
Facilities and utilities (15-25% of operating costs):
Electricity (projection, HVAC, lighting): €30,000-60,000 annual depending on climate
Internet and communications: €3,000-6,000 annual
Cleaning and consumables: €8,000-15,000 annual
Insurance: €10,000-20,000 annual
Rent or lease payments (if applicable): Variable, often structured as revenue share rather than fixed rent
Marketing and administration (5-10% of operating costs):
Point-of-sale materials: €5,000-10,000 annual
Digital marketing and partnerships: €8,000-15,000 annual
Professional services (legal, accounting): €5,000-10,000 annual
Sensitivity analysis: Key variables impacting returns
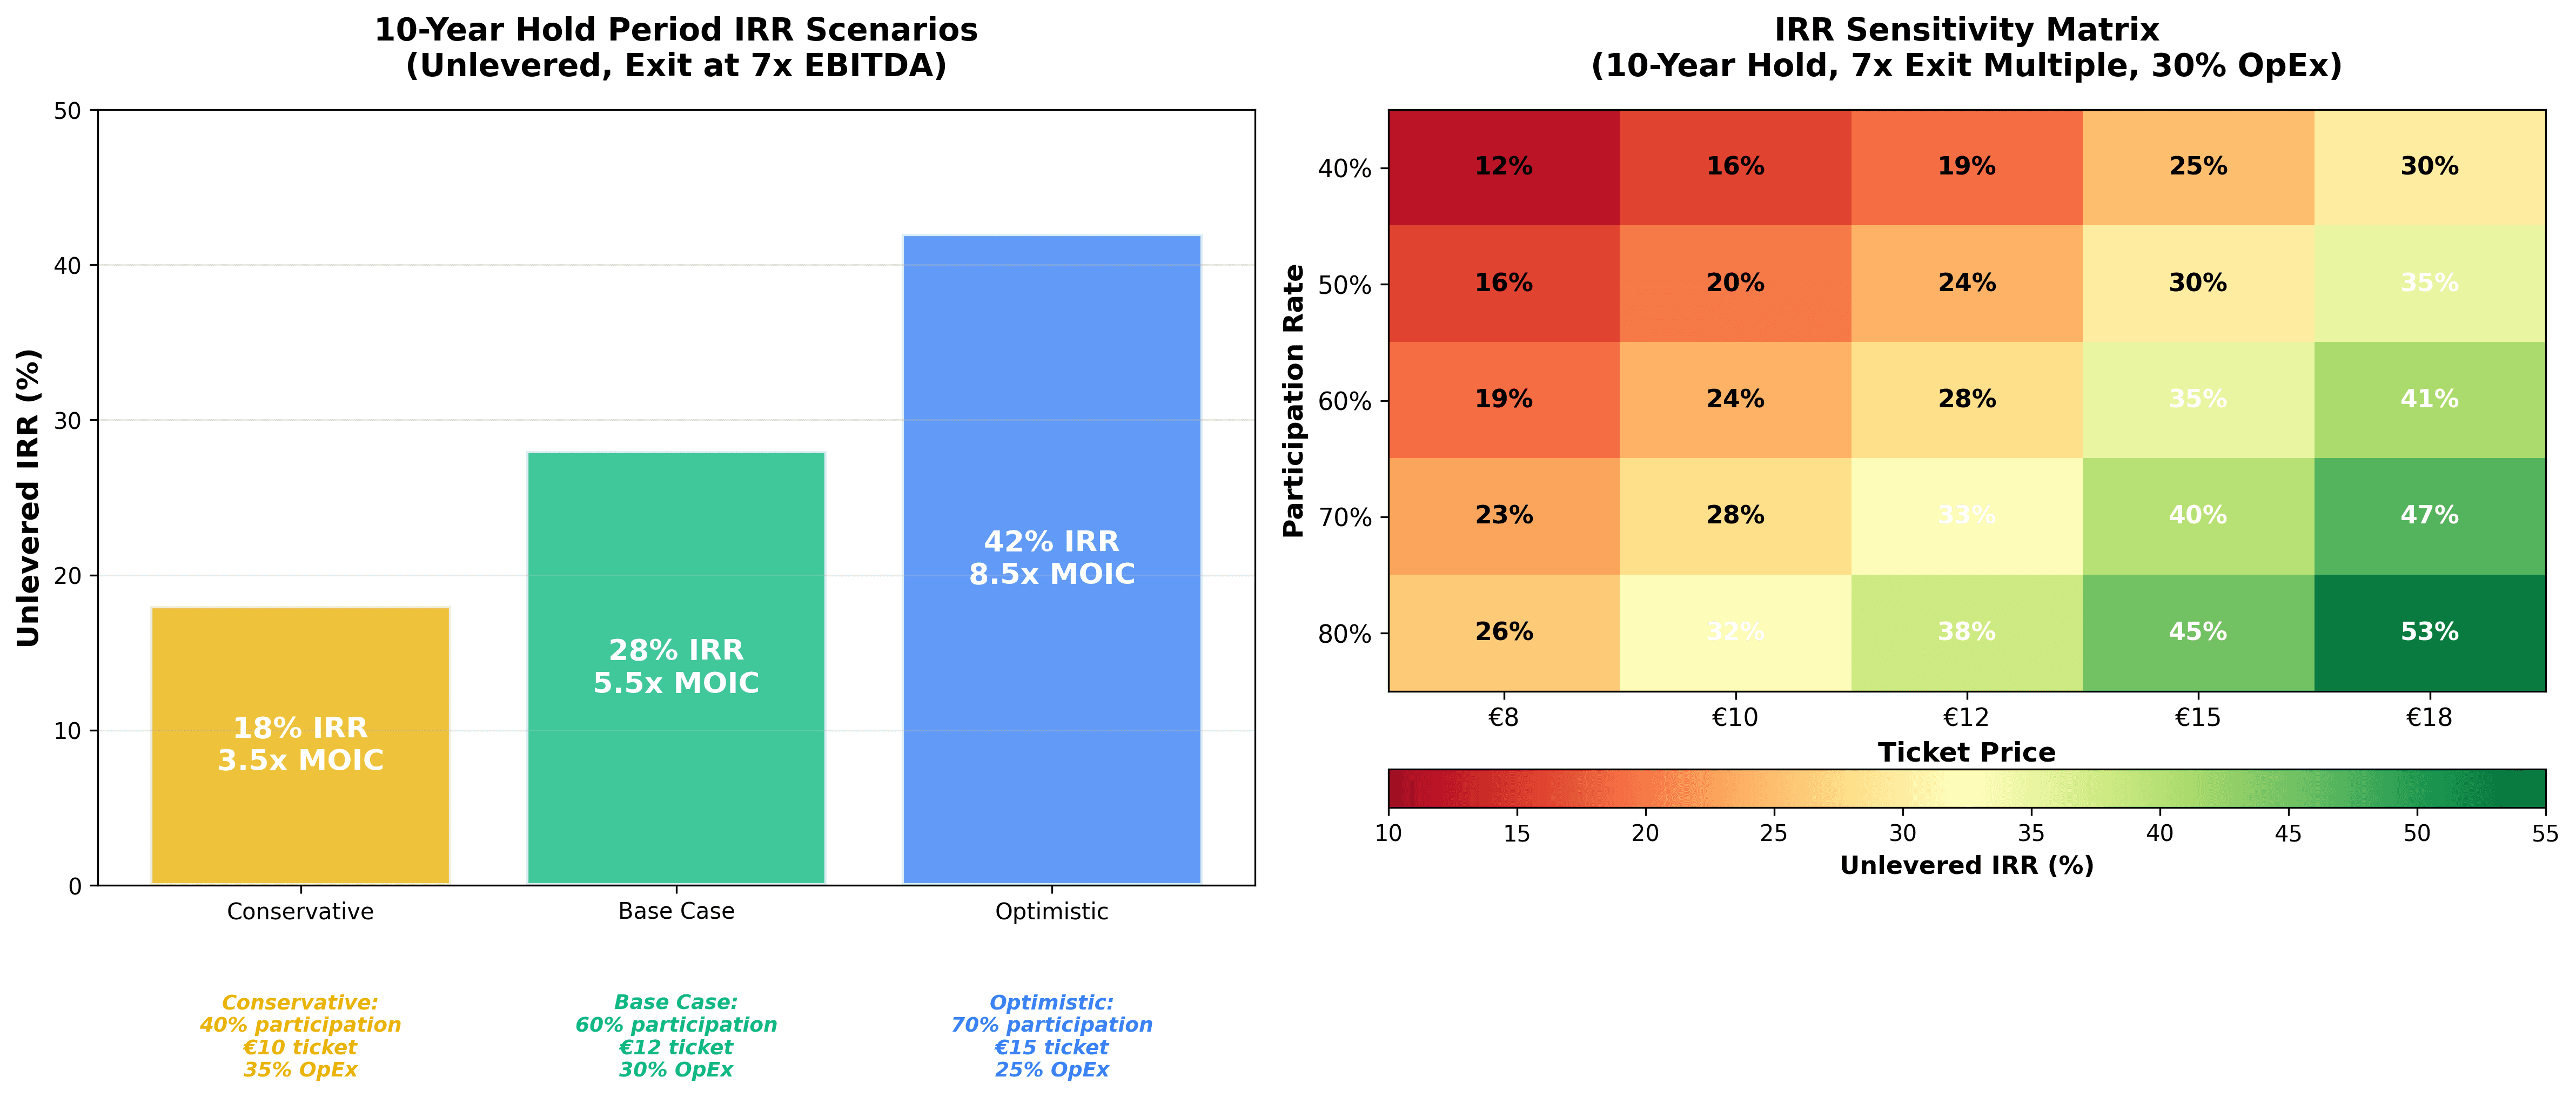
Investment return scenarios across operational parameter ranges: Conservative case (40% participation, €10 ticket, 35% opex) generates 18% unlevered IRR and 3.5x MOIC. Base case (60% participation, €12 ticket, 30% opex) achieves 28% IRR and 5.5x MOIC. Optimistic scenario (70% participation, €15 ticket, 25% opex) reaches 42% IRR and 8.5x MOIC. Sensitivity matrix demonstrates attractive returns across wide parameter ranges. All scenarios assume 10-year hold period and exit at 7x EBITDA multiple.
Investors should model multiple scenarios across critical assumptions:
Participation rate sensitivity:
Participation | Annual Visitors | Gross Revenue | EBITDA | Payback (months) |
|---|---|---|---|---|
40% | 120,000 | €1,440,000 | €1,008,000 | 20 |
50% | 150,000 | €1,800,000 | €1,260,000 | 16 |
60% | 180,000 | €2,160,000 | €1,512,000 | 13.5 |
70% | 210,000 | €2,520,000 | €1,764,000 | 12 |
(Base case: 300,000 ferry passengers, €12 ticket, 30% operating cost ratio)
Pricing sensitivity:
Ticket Price | Gross Revenue | EBITDA | Payback (months) |
|---|---|---|---|
€10 | €1,800,000 | €1,260,000 | 16 |
€12 | €2,160,000 | €1,512,000 | 13.5 |
€15 | €2,700,000 | €1,890,000 | 11 |
€18 | €3,240,000 | €2,268,000 | 9 |
(Base case: 180,000 visitors, 30% operating cost ratio)
Operating cost sensitivity:
Opex Ratio | EBITDA | EBITDA Margin | Payback (months) |
|---|---|---|---|
25% | €1,620,000 | 75% | 13 |
30% | €1,512,000 | 70% | 13.5 |
35% | €1,404,000 | 65% | 15 |
40% | €1,296,000 | 60% | 16 |
(Base case: €2,160,000 gross revenue)
Key insight: Gateway economics remain attractive across wide parameter ranges. Even conservative scenarios (40% participation, €10 ticket, 35% opex ratio) generate 18-month payback and ~60% EBITDA margins – superior to most conventional tourism infrastructure.
Risk factors and mitigation strategies
All infrastructure investments carry execution, operational and market risks. Gateways present specific risk profiles that experienced investors can assess and mitigate.
Execution risks: Development, permitting and technology integration
Regulatory approval delays:
Heritage sites, protected areas and waterfront locations involve complex permitting. Applications can face environmental reviews, cultural heritage assessments and community consultation requirements extending timelines 6-12 months beyond initial projections.
Mitigation: Engage regulatory authorities during feasibility phase. Structure partnerships with destination management organisations, port authorities or park services that hold existing permits and land tenure. Build 25-30% timeline contingency into project schedules and phased capital calls.
Construction cost overruns:
Site-specific conditions – soil stability, utility access, climate constraints – can inflate infrastructure costs. Technology procurement from specialised suppliers creates vendor concentration risk.
Mitigation: Conduct thorough site surveys and geotechnical studies before capital commitment. Negotiate fixed-price turnkey contracts with penalty clauses for delays. Maintain relationships with multiple projection system and dome structure manufacturers to ensure competitive pricing. Budget 15-20% construction contingency.
Content production challenges:
Immersive content requires specialised production capabilities (underwater cinematography, aerial filming, CGI integration). Local knowledge holders and cultural advisors may impose constraints on narrative framing or visual representation.
Mitigation:
Partner with established immersive content production houses with destination storytelling portfolios. Engage cultural advisors and conservation scientists early in script development. Allocate sufficient time (6-10 months) and budget for iterative content refinement. License existing content for initial operations while developing custom productions.
Operational risks: Participation rates, technology reliability and seasonality
Lower-than-projected participation rates:
Gateway venues achieving only 30-40% participation versus 60% modelled face material cash flow shortfalls. This typically results from poor physical placement (not integrated into natural visitor flows), weak marketing by transport partners or competing attractions capturing wallet share.
Mitigation: Prioritise locations with structural visitor concentration (ferry terminals, cruise ports, airport gates) over secondary sites. Negotiate contractual commitments from transport operators to actively promote gateway experiences. Conduct visitor surveys during feasibility to validate stated interest. Structure partnerships with revenue-sharing that aligns operator incentives.
Technology downtime:
Projection systems, media servers and audio equipment can fail, creating service interruptions that damage reputation and revenue. Remote locations complicate maintenance and part availability.
Mitigation: Specify commercial-grade equipment with manufacturer service level agreements. Maintain on-site spare critical components (projector lamps, media server backup). Train local staff for basic troubleshooting. For portfolio operations, employ roving technical specialists serving multiple venues. Budget 2-3% of capex annually for technology refresh.
Extreme seasonality:
Destinations with compressed high seasons (e.g., Mediterranean islands, alpine resorts) can see 70-80% of annual revenue concentrated in 12-16 weeks. This creates cash flow volatility and complicates staffing.
Mitigation: Pursue year-round destinations or diversified portfolio across hemispheres. Develop off-season programming targeting residents, school groups and conference visitors. Negotiate variable cost structures (seasonal staffing, consumption-based utility contracts). Model conservative revenue assumptions assuming high-season participation rates don't fully compensate for low-season periods.
Market risks: Tourism demand volatility and competitive dynamics
Macroeconomic shocks and travel disruption:
COVID-19 demonstrated tourism's vulnerability to pandemics, geopolitical events and economic recession. International visitor arrivals declined 70% in 2020, with recovery to 2019 levels taking 3+ years in many markets.
Mitigation: Target destinations with diversified visitor source markets and domestic tourism resilience. Structure financing with covenant flexibility and cash reserves sufficient for 6-12 month low-revenue scenarios. Develop content with local market appeal to maintain operations during international travel disruptions. Consider political risk insurance for destinations with governance instability.
Technological substitution:
Consumer VR headsets and web-based immersive experiences could reduce willingness-to-pay for location-based immersive entertainment. While current technology limitations favour shared spatial experiences, rapid advancement could erode gateway value propositions.
Mitigation: Focus on destination-specific, high-production-value content that cannot be easily replicated digitally. Emphasise social/shared experience aspects that individual VR consumption cannot match. Maintain technology refresh cycles to ensure venues represent state-of-art immersive capability. Monitor consumer preference trends through regular visitor satisfaction surveys.
Destination saturation:
Multiple gateway venues in single destinations could fragment visitor attention and reduce participation rates. This risk increases as the asset class scales and competing developers enter markets.
Mitigation: Pursue exclusive operating agreements with destination authorities, transport operators or protected area managers. Differentiate content across venues (historical vs ecological themes, family vs premium positioning). For portfolio strategies, prioritise geographic diversification over market concentration. Establish strong destination relationships and brand recognition to deter new entrants.
Impact measurement: Credible metrics that satisfy institutional mandates
Impact investors require evidence that capital deployment achieves stated environmental and social outcomes alongside financial returns. Gateway investments lend themselves to quantifiable impact tracking across multiple dimensions.
Environmental impact: Measurable pressure reduction
Physical site visitation changes:
Track visitor numbers, dwell times and spatial distribution at sensitive sites before and after gateway implementation. Meaningful metrics include:
Percentage reduction in visitor-hours at most ecologically fragile zones
Shift in visitor distribution from concentrated hotspots to broader destination fabric
Reduction in off-trail incidents, wildlife disturbance reports and habitat degradation measures
Measurement approach: Establish baseline through ranger logs, automated trail counters and periodic observational surveys 6-12 months pre-launch. Continue monitoring post-launch with quarterly reporting. Control for overall visitor growth through normalised metrics (e.g., incidents per 10,000 visitors).
Typical impact range: Well-implemented gateways achieve 20-40% reduction in peak-period crowding at most sensitive sites and 15-25% improvement in visitor compliance with marked paths and wildlife distance protocols.
Substitution of high-impact visits:
Quantify visitors choosing gateway-only experiences rather than accessing physical sites. This particularly matters for sensitive marine environments where every boat trip, dive or snorkel session carries ecological costs.
Number of gateway visitors who do not proceed to physical site (captured through exit surveys and ticketing data)
Estimated ecosystem impact avoided (calculated using site-specific impact assessments: e.g., coral reef contact incidents avoided, turtle nesting disruption prevented)
Measurement approach: Embed questions in ticketing process and post-experience surveys: "Will you visit [physical site] after this experience?" and follow-up: "Did visiting the gateway change your plans?" Link responses to visitor registration data to validate claims.
Typical impact range: 10-20% of gateway visitors in island/coastal contexts report choosing gateway-only visit, particularly among families with young children, elderly travellers and non-swimmers. This translates to 20,000-40,000 avoided high-impact visits annually in 200,000-visitor gateway scenarios.
Carbon footprint per visitor experience:
Calculate GHG emissions per visitor served by gateway experience versus conventional destination experiences requiring transport, accommodation and site access.
Gateway per-visitor carbon: Facility energy consumption divided by annual visitors (typically 2-5 kg CO2e per visitor for grid-powered venues)
Conventional experience per-visitor carbon: Transport emissions (boat, vehicle, aircraft) plus accommodation plus site operations (typically 50-200 kg CO2e per visitor-day depending on transport modes and distance)
Measurement approach: Conduct lifecycle assessment following ISO 14040 standards for gateway infrastructure. Compare to destination-specific transport and accommodation emission factors published by recognised sources (DEFRA, EPA, academic studies).
Typical impact range: Gateway experiences deliver 90-95% lower carbon intensity per visitor-hour of engagement versus conventional tourism experiences requiring transport and physical site access.
Social impact: Community benefits and cultural preservation
Local employment generation:
Track direct jobs created (gateway operations) and indirect employment supported (content production, construction, maintenance supply chains).
FTE jobs per million euros invested (typically 3-4 direct FTE per €1.5M gateway capex)
Percentage of workforce from local community (target >60% for impact-certified projects)
Total payroll distributed to local economy annually
Measurement approach: HR systems track employment. Conduct periodic economic impact assessments using input-output models to estimate indirect employment effects.
Revenue allocation to community benefit:
Many gateway partnerships dedicate portions of ticket revenue to community funds, indigenous groups or local NGOs. Transparent allocation and reporting demonstrates commitment beyond profit extraction.
Percentage of gross revenue dedicated to community benefit (typical range: 5-15%)
Community benefit fund disbursement by category (education, infrastructure, cultural programmes, conservation)
Number of community members directly benefiting from programmes
Measurement approach: Contractual revenue-sharing agreements establish allocation formulas. Community benefit funds issue quarterly reports documenting disbursements and beneficiaries.
Cultural narrative control and representation:
Indigenous communities and local knowledge holders often express concerns about outsiders profiting from cultural narratives without meaningful participation or benefit. Impact-aligned gateway development involves communities in content creation and ensures accurate, respectful representation.
Number of local knowledge holders, artists and scientists involved in content development (production credits, advisory roles, performance)
Community approval of narrative framing and visual representation (documented through formal consultation)
Mechanisms for ongoing content review and cultural sensitivity monitoring
Measurement approach: Document community engagement through project development logs, advisory board meeting minutes and content approval processes. Conduct post-launch interviews with community representatives assessing satisfaction with cultural representation.
Economic impact: Destination-level effects
Tourism revenue retention:
Gateway investments increase the share of tourism spending captured locally versus leaking to external operators (international cruise lines, multinational hotel chains, foreign tour operators).
Percentage of gateway revenue retained in destination economy (labour, local suppliers, community benefit allocation)
Comparison to revenue retention rates for conventional tourism infrastructure (typically 30-50% for international hotels, 20-30% for cruise tourism)
Measurement approach: Economic impact analysis tracing revenue flows. Gateway operations typically retain 70-85% of revenue locally through direct staffing, local procurement and community partnerships.
Destination competitiveness enhancement:
Gateways contribute to broader destination value proposition, supporting tourism sector sustainability and resident quality of life – factors that drive long-term destination competitiveness.
Change in destination sustainability certification status (GSTC, Green Destinations, UNESCO recognition)
Resident sentiment towards tourism (measured through periodic surveys)
Destination marketing differentiation (media coverage emphasising sustainability leadership)
Measurement approach: Track certification applications referencing gateway infrastructure as supporting evidence. Conduct annual resident surveys on tourism impacts and support. Monitor media sentiment analysis.
Impact reporting frameworks and standards
Institutional impact investors increasingly require alignment with established measurement frameworks:
IRIS+ metrics (Global Impact Investing Network):
PI9468: Total greenhouse gas emissions
PI1263: Client individuals: environmentally disadvantaged
OI6107: Employment created (direct)
PI8378: Client satisfaction
UN Sustainable Development Goals (SDGs):
SDG 8 (Decent Work and Economic Growth): Employment metrics, local procurement
SDG 12 (Responsible Consumption and Production): Resource efficiency, waste reduction
SDG 13 (Climate Action): Carbon footprint reduction
SDG 14 (Life Below Water): Marine ecosystem protection (for coastal gateways)
SDG 15 (Life on Land): Terrestrial ecosystem protection
Impact Management Project (IMP) dimensions:
What: Reduced environmental pressure, enhanced cultural preservation, local employment
Who: Destination communities, ecosystem beneficiaries, visitor education
How Much: Quantified metrics across dimensions above
Contribution: Counterfactual analysis (what would happen without gateway investment)
Risk: Monitoring for negative externalities, safeguard mechanisms
Investors pursuing B Corporation certification, Article 9 fund classification (EU SFDR) or similar impact credentials should structure gateway investments with robust measurement and reporting aligned to these frameworks from inception.
Portfolio construction: Geographic diversification and staged deployment
Experienced infrastructure investors construct portfolios balancing risk-adjusted returns, impact diversification and operational efficiency.
Geographic diversification rationale
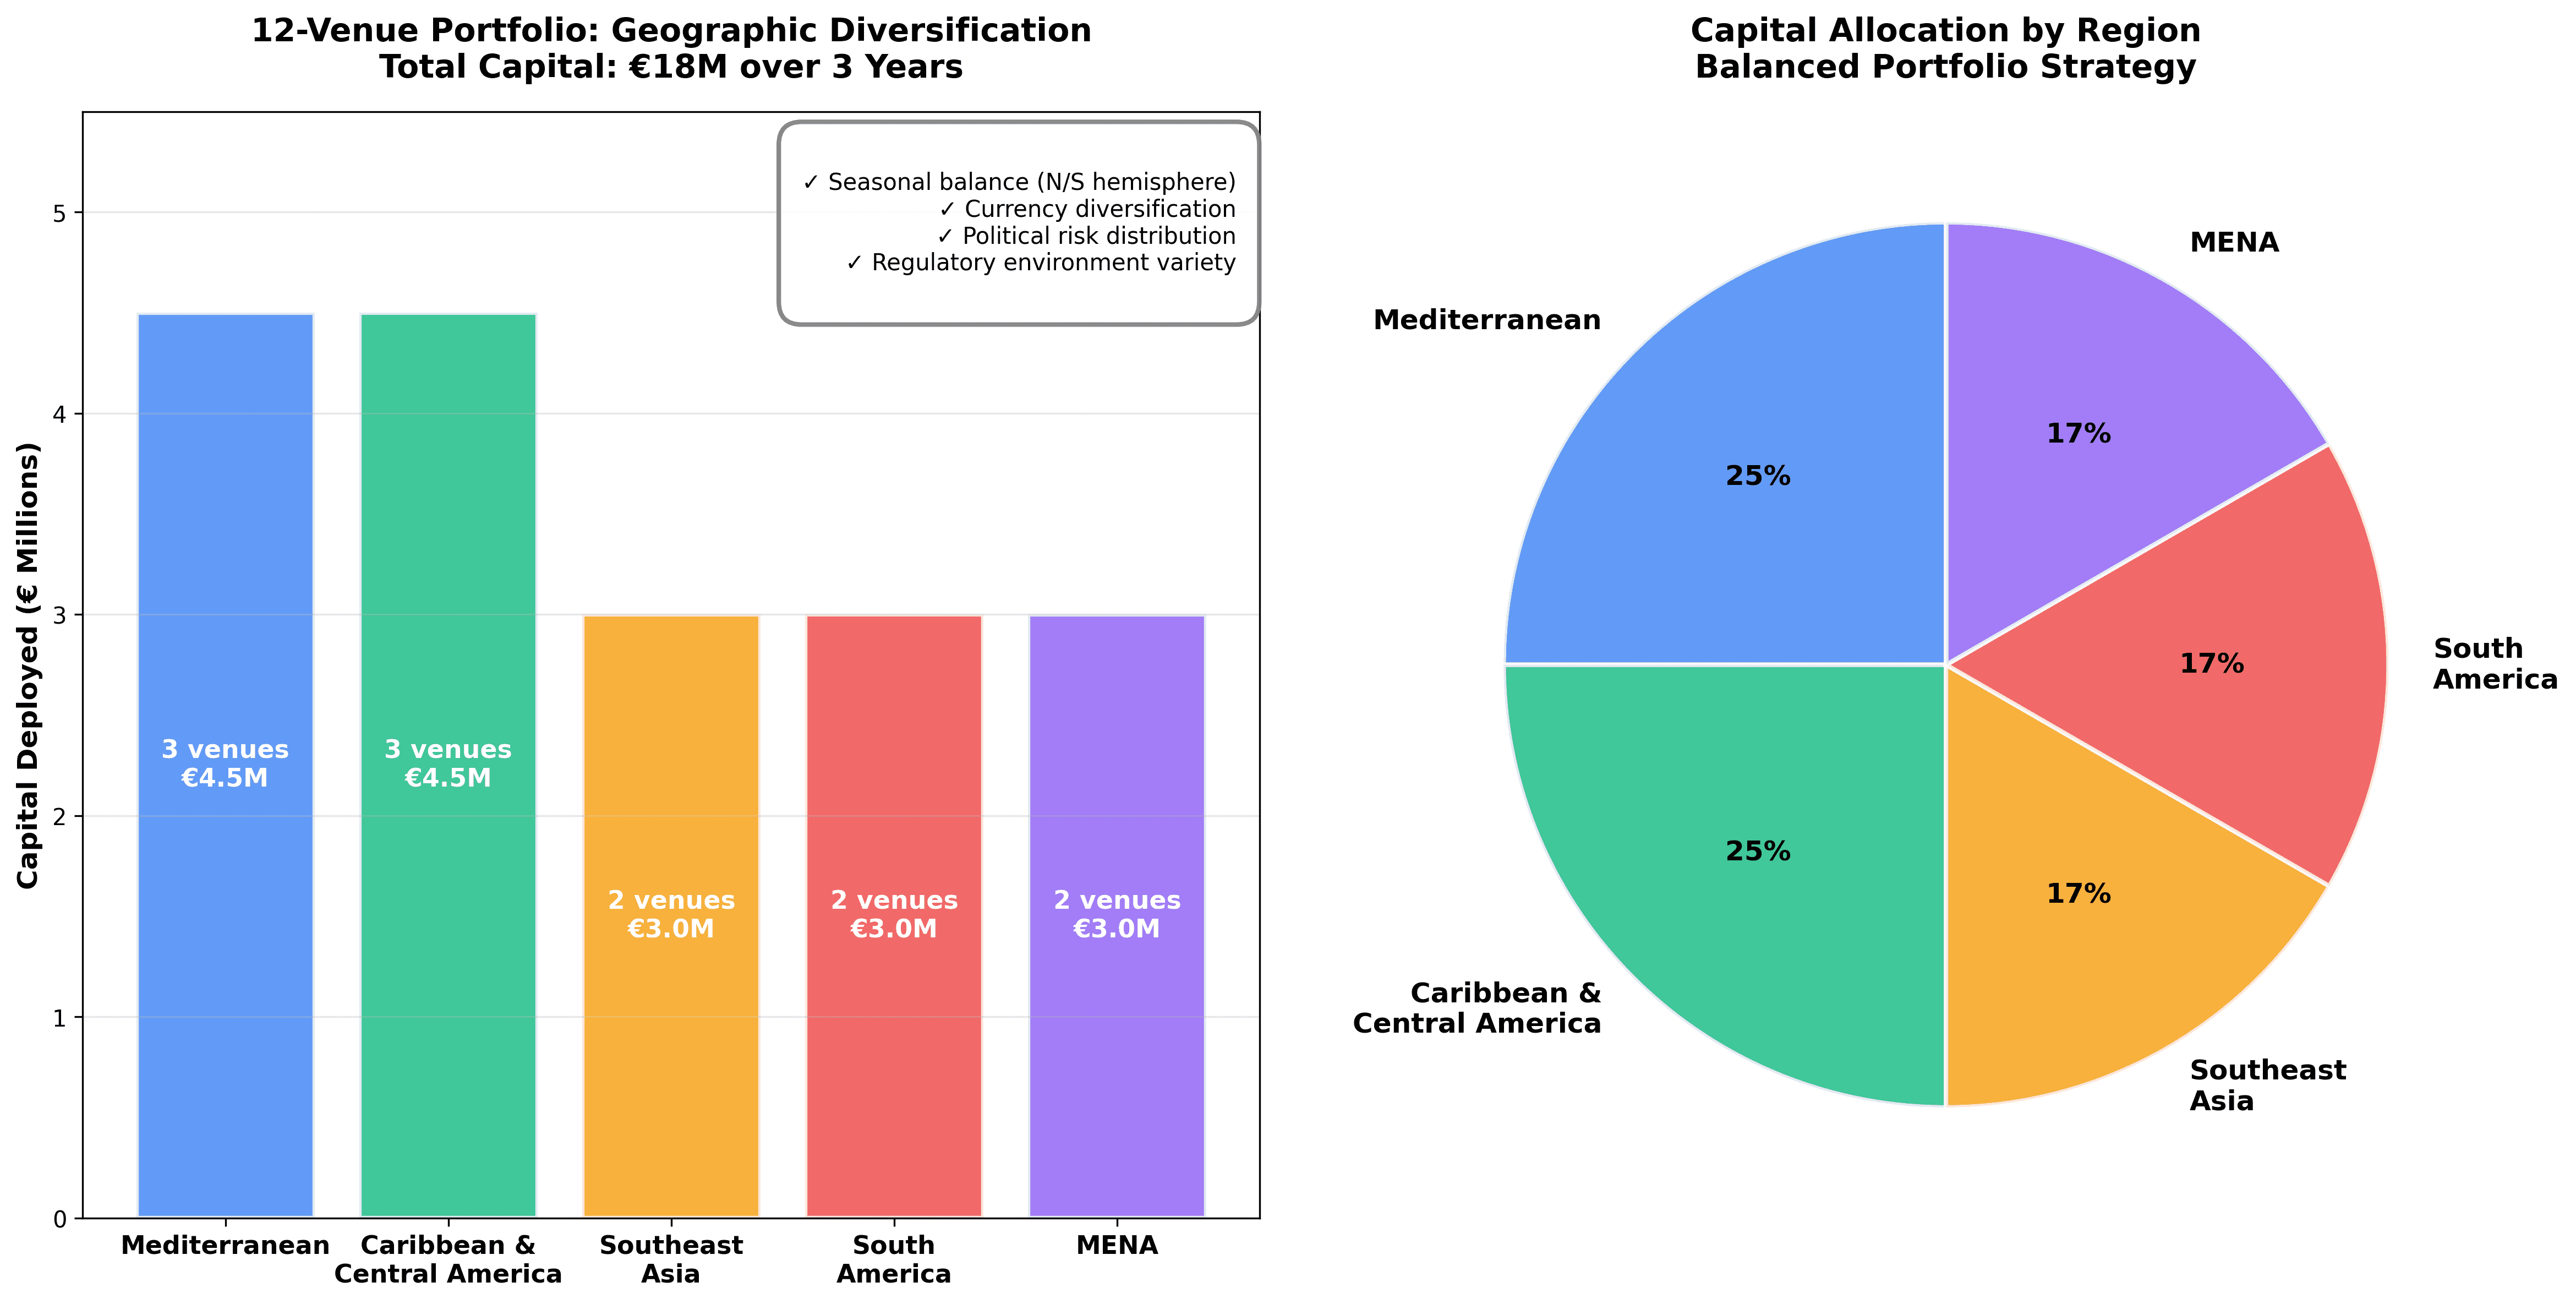
Diversified 12-venue portfolio allocation across five geographic regions balances risk and operational efficiency: Mediterranean (3 venues, €4.5M), Caribbean & Central America (3 venues, €4.5M), Southeast Asia (2 venues, €3M), South America (2 venues, €3M), MENA (2 venues, €3M). Geographic spread provides seasonal balance (Northern/Southern hemisphere), currency diversification, political system variety and regulatory environment exposure. Portfolio deployed over 3-year investment period achieving scale economies while managing concentration risk.
Correlation with global tourism patterns: Individual destinations experience idiosyncratic shocks – natural disasters, political instability, pandemic closures, infrastructure failures. Portfolio construction across geographically distributed, politically diverse destinations reduces correlation with any single market downturn.
Recommended approach: Target 8-12 gateway venues across at least 4 geographic regions within 5-year deployment period. Avoid concentration in single country (regulatory risk) or climate zone (correlated weather impacts).
Example diversified portfolio:
Mediterranean islands (2-3 gateways): Santorini, Capri, Balearics
Caribbean/Central America (2-3 gateways): Belize Barrier Reef, Roatán, Dominica
Southeast Asia (2-3 gateways): Phi Phi Islands, Raja Ampat, Komodo
South America (1-2 gateways): Galápagos, Patagonia coastal access points
Middle East/North Africa (1-2 gateways): Red Sea destinations, Moroccan heritage cities
This distribution provides:
Seasonal balance (Northern/Southern hemisphere offsetting)
Political system diversity (democratic/authoritarian, stable/emerging)
Currency diversification (EUR, USD, local currencies)
Regulatory environment variety (EU standards, developing market contexts)
Staged deployment: Proof-of-concept to portfolio scale
Stage 1: Proof-of-concept (Years 1-2)
Deploy capital into 1-2 flagship gateways in best-validated contexts:
High visitor throughput (300,000+ annual arrivals)
Strong destination partnerships (port authority, DMO, national park)
Straightforward regulatory environment
Existing overtourism or conservation pressure creating pull demand
Capital deployment: €3-5 million total Objectives: Validate unit economics, refine operational systems, establish content production capabilities, generate demonstration cases for subsequent fundraising
Stage 2: Replication (Years 2-4)
Scale to 4-8 additional venues leveraging Stage 1 learnings:
Standardised technology specifications reducing procurement costs 20-30%
Proven operational playbooks minimising staff training and process development
Content library allowing licensing and adaptation rather than full custom production
Centralised functions (finance, technology support, content management) achieving economies of scale
Capital deployment: €12-20 million total Objectives: Build diversified portfolio, validate replicability across destination types, achieve operational positive cash flow at portfolio level
Stage 3: Portfolio optimisation (Years 4-7)
Grow to 12-20 venues with sophisticated operations:
Second-generation content replacing initial productions
Technology refresh cycles maintaining state-of-art visitor experience
Mature destination partnerships generating pull demand for expansion
Exit optionality through portfolio sale or venue-level refinancing
Capital deployment: €25-40 million total Objectives: Maximise operational efficiency, build brand recognition, position for exit or continued growth capital infusion
Partnership models: Operating structures and governance
Operating structures:
Developer-operator: Investor entity develops infrastructure, produces content and operates venues directly. Maximises control and margin capture but requires operational expertise and destination presence.
Developer-licensor: Investor entity develops infrastructure and licenses to local operators (DMOs, transport companies, hospitality groups). Reduces operational complexity but shares margin. Suitable for investors preferring infrastructure ownership without day-to-day management.
Joint venture: Investor entity partners with destination authority or local operator in shared ownership. Aligns incentives, builds local relationships and can accelerate permitting, but creates governance complexity and limits control.
Platform approach: Investor provides capital and technical expertise while local operators retain venue ownership and operations. Investor earns returns through technology licensing, content licensing and management fees. Lower capital intensity but reduced upside capture.
Governance considerations:
Gateway investments span commercial infrastructure, conservation outcomes and community engagement. Governance structures should reflect multi-stakeholder accountability:
Advisory boards including destination authorities, conservation organisations and community representatives
Impact measurement and reporting protocols documented in shareholder agreements
Community benefit allocation formulas with transparent disbursement reporting
Content approval processes ensuring cultural sensitivity and scientific accuracy
Conflicts of interest policies managing relationships with vendors, destination officials and conservation partners
Exit strategies and value realisation
Infrastructure investors typically target 7-12 year hold periods with multiple exit pathways.
Strategic sale to destination operators
Buyer profile: Destination management companies, national park services, large hospitality groups seeking to integrate gateway venues into broader operations.
Value proposition: Buyers gain proven infrastructure generating stable cash flows, established community relationships and differentiated destination offerings. Gateway venues complement core businesses (hotels, transport, attractions) and support sustainability positioning.
Valuation basis: 6-10x EBITDA multiples typical for profitable tourism infrastructure with long-term partnerships and contractual revenue streams. Higher multiples (8-10x) achieved when multiple strategic buyers compete or gateway has exclusive operating agreements.
Example: €1.5M capex gateway generating €1.5M annual EBITDA sold at 8x multiple = €12M enterprise value. Investor receives ~8x MOIC over 5-year hold period.
Sale to impact infrastructure funds
Buyer profile: Infrastructure funds with sustainability mandates seeking operational assets with demonstrated impact and stable yield.
Value proposition: Buyers acquire diversified portfolio of cashflow-generating assets with measurable environmental and social outcomes, suitable for impact-oriented institutional capital (pension funds, insurance companies, endowments).
Valuation basis: Portfolio-level transactions often command premiums versus single-asset sales due to diversification value and operational scale. Buyers typically underwrite 7-10% unlevered returns with moderate leverage potential.
Example: 12-gateway portfolio with €6M aggregate EBITDA, €75-90M valuation range (12.5-15x EBITDA), reflecting portfolio quality premium and impact investor demand.
Refinancing and recapitalisation
Structure: Once gateways achieve operational track record (2-3 years), debt financing becomes available to return equity capital while maintaining ownership.
Lender profile: Local development banks, impact-oriented debt funds, conservation finance facilities.
Debt capacity: Conservative underwriting supports 2.5-3.5x EBITDA in senior debt at 6-9% interest rates (depending on jurisdiction and credit profile). Allows return of 60-70% of initial equity while retaining upside.
Example: Gateway with €1.5M EBITDA secures €4M debt facility, returning €2.7M of initial €1.7M equity (160% cash return) while retaining ownership and ongoing cash distributions.
Secondary sale to local operators
Buyer profile: Local government entities, community tourism cooperatives, conservation NGOs seeking to acquire infrastructure serving public missions.
Value proposition: Local buyers value community benefit, conservation outcomes and long-term destination stewardship over pure financial returns. Willing to pay moderate premiums for assets aligned with public-interest mandates.
Valuation basis: Often negotiated based on social value alongside financial metrics. Can achieve favourable exits when gateways are structured from inception with eventual local ownership as objective.
Example: National park service purchases gateway at 6x EBITDA (below market) but investor achieves impact legacy and maintains positive relationships for future projects.
Hold-to-perpetuity with yield focus
Strategy: Maintain gateway portfolio as long-duration yield-generating assets, distributing cash flow to investors rather than pursuing exit.
Investor profile: Family offices, endowments and impact investors with long time horizons and preference for sustainable yield over capital gains.
Return profile: After debt refinancing and operational maturity, gateways can distribute 12-18% cash-on-cash returns annually to remaining equity, providing inflation-protected income streams aligned with long-duration impact commitments.
Competitive landscape and differentiation
Current market participants
The immersive tourism infrastructure space remains fragmented with three investor categories:
Large-scale mixed-use developers: Major hospitality and entertainment conglomerates (MGM, Dubai Holding, Saudi PIF) integrate immersive components into resort clusters, theme parks and mega-developments. Focus on visitor attraction and destination branding rather than conservation outcomes.
Capital deployed: Billions across multi-year developments Competitive positioning: Operate at scale exceeding smaller investors but face high capital intensity, slow deployment and complex regulatory environments. Limited focus on overtourism mitigation or protected area contexts.
Niche immersive entertainment companies: Specialised firms deploying fulldome theatres, flying theatres and branded experiences (Triotech, Brogent Technologies, Evans & Sutherland). Primarily serve aquariums, science centres, theme parks and shopping malls.
Capital deployed: Millions per project Competitive positioning: Strong technology capabilities and content production but limited destination management expertise or impact measurement frameworks. Serve commercial entertainment rather than conservation-oriented applications.
Early-stage impact-focused developers: Origin of Wonder and similar ventures specifically targeting conservation gateways with integrated impact measurement and destination partnerships.
Capital deployed: Seed to early growth stage, typically <€10M aggregate Competitive positioning: Purpose-built for overtourism/conservation contexts but limited track record and capital availability. Potential for first-mover advantage as impact investor interest grows.
Differentiation strategies for new entrants
Investors building gateway portfolios should pursue clear differentiation:
Impact integration from inception: Structure investments with impact measurement, community benefit allocation and conservation partnerships core to business model rather than added reporting layer. This positions assets for impact-focused exit buyers and unlocks blended finance.
Destination partnership depth: Prioritise quality relationships with DMOs, protected area managers and transport operators over opportunistic site acquisition. Long-term partnerships create competitive moats and reduce regulatory/operational risk.
Technology platform strategy: Standardise on proven immersive technology platforms (e.g., Spitz dome systems, Brogent flying theatres) while maintaining content flexibility. Avoid expensive custom technology development in favour of operational and content differentiation.
Portfolio over one-off deals: Commit to systematic deployment (8-15 gateways over 5-7 years) rather than single opportunistic investments. Portfolio approach attracts operational talent, justifies centralised functions and creates exit optionality.
Due diligence framework for investors
Disciplined due diligence separates attractive gateway opportunities from problematic investments.
Commercial due diligence
Visitor flow validation:
Obtain 3-5 years of visitor arrival data from destination authorities, port operators or park services
Validate seasonality patterns and growth trends
Interview transport operators and hotels about forward booking indicators
Assess risk of structural demand decline (e.g., climate impacts, political instability, competing destinations)
Participation rate assessment:
Survey visitor willingness-to-pay and interest in immersive experiences
Benchmark against comparable venues in similar contexts
Model conservative, base and optimistic participation scenarios with probability weighting
Validate assumptions through test marketing or soft launches where feasible
Competitive analysis:
Inventory existing attractions competing for visitor time and wallet share
Assess differentiation value of proposed gateway content and technology
Evaluate barriers to entry for competing developments
Review destination tourism master plans for potential conflicting infrastructure
Technical due diligence
Site assessment:
Conduct geotechnical survey and structural engineering review
Verify utility availability and capacity (electrical, water, sewage, internet)
Assess climate control requirements (tropical humidity, extreme heat, coastal salt exposure)
Review accessibility, parking and visitor flow circulation
Technology specification:
Validate projection system capabilities (resolution, brightness, media format support)
Assess audio system quality and immersive sound design feasibility
Review media server redundancy and backup systems
Evaluate technology obsolescence risk and refresh cost projections
Content production capacity:
Verify production partner credentials and portfolio
Review production timeline and deliverable milestones
Assess script quality, scientific accuracy and cultural sensitivity
Confirm intellectual property ownership and licensing terms
Legal and regulatory due diligence
Land tenure and permits:
Verify clear title or long-term lease rights (minimum 15-20 years for infrastructure investment)
Review zoning compliance and building permit requirements
Identify environmental impact assessment obligations
Assess heritage protection constraints and approval processes
Partnership agreements:
Review contracts with destination authorities, transport operators and venue hosts
Assess revenue-sharing formulas, term lengths and renewal conditions
Identify change-of-control provisions, assignment restrictions and exit constraints
Evaluate governance rights, reporting obligations and performance standards
Liability and insurance:
Confirm adequate general liability coverage (minimum €5M recommended)
Review visitor accident/injury insurance requirements
Assess force majeure provisions and business interruption coverage
Evaluate environmental liability for coastal or protected area locations
Impact due diligence
Baseline impact assessment:
Quantify current destination pressure (visitor numbers, ecological damage indicators, resident complaints)
Establish baseline environmental metrics (habitat condition, species stress, pollution levels)
Document community sentiment and stakeholder relationships
Assess credibility of impact claims through independent validation
Impact measurement framework:
Review proposed metrics for alignment with IRIS+, SDGs and investor reporting requirements
Assess feasibility of data collection and frequency of reporting
Evaluate third-party verification or audit provisions
Confirm impact reporting integration into governance and incentive structures
Safeguard assessment:
Review community consultation processes and informed consent documentation
Assess cultural sensitivity of content and community representation
Evaluate labour practices, local hiring commitments and fair wage policies
Identify potential negative externalities (gentrification, cultural appropriation risks) and mitigation plans
Frequently Asked Questions
What returns should investors expect from immersive gateway investments?
Return profiles vary by deployment strategy, leverage and hold period. Unlevered returns for well-executed portfolios typically fall in the 15-25% IRR range over 7-10 year holds, comparable to middle-market infrastructure but with higher impact credentials.
Conservative single-gateway scenarios with €1.5M capex generating €1M EBITDA produce 8-12% unlevered cash yields in Year 2-3 post-stabilisation. Portfolio-scale operations achieving operational efficiencies and leveraging content across venues can reach 15-20% cash yields on stabilised equity.
Exit multiples of 6-10x EBITDA are reasonable expectations for strategic sales to destination operators or impact infrastructure funds. This translates to 5-8x MOIC over 5-7 year hold periods when combining cash distributions and exit proceeds.
Debt financing at 2.5-3.5x EBITDA (post-operational track record) can enhance equity returns to 20-30% IRR through refinancing and recapitalisation strategies while maintaining ownership.
Impact-adjusted returns incorporate non-financial value from environmental and social outcomes. Investors valuing impact alongside returns may accept 2-4 percentage points lower IRR in exchange for measurable conservation outcomes and community benefits that conventional tourism infrastructure cannot deliver.
How does gateway risk/return compare to traditional tourism real estate?
Gateway investments offer superior impact credentials, faster payback periods and lower construction risk compared to hotels or resorts, but face technology obsolescence and participation rate uncertainty that real estate avoids.
Capital efficiency: Gateways require €1.5-2M capex per venue versus €15-30M+ for boutique hotels or €100M+ for resort developments. Lower capital intensity permits faster deployment, easier portfolio diversification and reduced absolute loss exposure per investment.
Time-to-cash-flow: Gateways reach operational cash flow in 18-24 months (design, permitting, construction, launch) versus 36-60 months typical for hotel developments. Shorter duration reduces construction risk and interest carry costs.
Operational leverage: Gateway operating cost structures (25-35% of revenue) deliver higher incremental profit margins than hotels (60-70% operating costs typical). This amplifies upside from participation rate outperformance.
Technology risk: Real estate holds value independent of technology trends; gateways require periodic technology refresh (projectors, media systems) to maintain competitive positioning. Budget 3-5% annual capex for technology upgrades.
Demand volatility: Hotels benefit from corporate travel and meeting/event demand providing some recession resistance. Gateways depend entirely on leisure tourism flows, creating higher revenue volatility during downturns.
Exit liquidity: Real estate benefits from deep capital markets and clear valuation standards (cap rates, comps). Gateway sales depend on smaller pools of strategic or impact-focused buyers, potentially constraining exit timing.
Investor implication: Gateways suit impact investors, family offices and funds comfortable with operational infrastructure and seeking higher returns than stabilised real estate, while accepting technology and operational risks. Not suitable for passive institutional capital seeking bond-like predictability.
What destination contexts generate best risk-adjusted returns?
Three destination characteristics predict attractive gateway economics:
1. Structural visitor concentration through limited access points
Islands accessible only by ferry, protected areas with controlled entry gates, heritage cities where cruise passengers disembark at single terminals. These create captive visitor flows with high participation rates (60-80%) and pricing power.
Best examples: Mediterranean islands (Santorini, Capri), Galápagos, small Caribbean diving destinations, heritage port cities (Dubrovnik, Kotor).
2. Existing overtourism pressure driving regulatory intervention
Destinations where resident backlash, ecosystem damage or heritage site stress creates policy urgency for management solutions. This generates pull demand from destination authorities and reduces regulatory friction for gateway approvals.
Best examples: Venice (cruise passenger limits), Maya Bay Thailand (temporary closures), Barcelona (tourist apartment restrictions), Balearic Islands (car rental limits).
3. Strong destination institutional capacity and tourism dependency
Locations with professional DMOs, established tourism industries and economic reliance on visitor spending. These contexts provide partnership stability, marketing support and political commitment to tourism infrastructure.
Best examples: EU member states with tourism dependency >10% GDP, established Caribbean tourism destinations, national parks in OECD countries.
Destinations combining all three characteristics (island access concentration + overtourism pressure + institutional capacity) generate best risk-adjusted returns. Examples include Greek islands, Adriatic heritage cities and established Caribbean dive destinations.
Avoid destinations with political instability, weak rule of law, currency controls or histories of nationalising foreign-owned assets. Also avoid destinations where tourism is nascent (insufficient visitor flows) or declining (structural demand issues).
How do impact investors validate conservation outcomes?
Credible impact measurement requires baseline establishment, ongoing monitoring and independent verification.
Baseline establishment (6-12 months pre-launch):
Collaborate with destination authorities, conservation NGOs and research institutions to document current conditions:
Visitor numbers and distribution across sensitive sites (ranger logs, automated counters)
Ecosystem health indicators (coral cover, wildlife population surveys, vegetation condition)
Resident sentiment (community surveys on tourism impacts and support)
Behaviour compliance (observational studies of rule-following)
These baselines provide comparison points for post-gateway impact assessment.
Ongoing monitoring (quarterly post-launch):
Implement systematic data collection integrated into operations:
Visitor tracking through ticketing systems (participation rates, demographic profiles)
Exit surveys measuring behavioural intentions and satisfaction
Site monitoring through ranger reports and remote sensing where applicable
Economic impact through employment records, procurement spending and community benefit disbursements
Independent verification (annual):
Contract third-party specialists to validate impact claims:
Conservation biologists assess ecosystem indicators
Social scientists conduct community perception surveys
Tourism economists evaluate destination-level effects
Impact measurement consultants audit data collection and reporting processes
Align measurement with established frameworks (IRIS+, SDGs) to ensure comparability and credibility with institutional investors.
Negative findings should trigger operational adjustments and transparent disclosure rather than suppression. Impact investing credibility depends on honest reporting of challenges alongside successes.
What role can Origin of Wonder play in investor partnerships?
Origin of Wonder provides comprehensive gateway development services across the investment lifecycle:
Pre-investment services:
Destination feasibility assessment using systematic profiling methodologies
Visitor flow analysis and participation rate projections
Financial modelling with conservative and optimised scenarios
Impact assessment frameworks aligned with investor reporting requirements
Due diligence support across commercial, technical, legal and impact dimensions
Development and deployment:
Gateway location selection applying multi-criteria frameworks
Partnership structuring with destination authorities, transport operators and conservation organisations
Technology procurement from specialised suppliers with negotiated pricing
Content production through established immersive storytelling networks
Project management from design through construction, commissioning and launch
Operations and optimisation:
Venue operations management or operator training and support (depending on chosen structure)
Content refresh and seasonal programming updates
Technology maintenance and upgrade cycles
Marketing integration with destination and transport partner campaigns
Performance monitoring and reporting systems
Portfolio scaling:
Multi-venue deployment strategies balancing diversification and efficiency
Centralised functions (finance, technology, content management) supporting portfolio operations
Additional venue identification and development pipeline management
Exit preparation including investor materials and strategic buyer identification
Partnership structures flexible based on investor preferences: Origin of Wonder can serve as:
Co-investor and operator: Shared equity with operational responsibility
Developer and asset manager: Fee-based development and ongoing management for investor-owned assets
Technical advisor: Support investor-led transactions with specialised expertise
Investors considering gateway portfolios can explore partnership options at Origin of Wonder destination partnerships page or request investment-focused consultations at investor relations contact.
How do gateways fit in sustainable tourism investment portfolios?
Gateways occupy a distinctive position in sustainable tourism investment taxonomy, combining infrastructure characteristics with impact venture attributes.
Portfolio allocation context:
Sustainable tourism investors typically allocate across:
Accommodation (40-60%): Eco-lodges, sustainable hotel conversions, glamping operations
Transport and mobility (10-20%): Electric shuttles, bike share, sustainable aviation fuel
Attractions and activities (15-25%): Wildlife viewing, cultural experiences, adventure tourism
Infrastructure and technology (10-20%): Digital booking platforms, waste management, renewable energy
Gateway venues fit naturally in infrastructure/technology allocation, often capturing 20-40% of this bucket
Correlation benefits:
Gateways exhibit lower correlation with accommodation and transport assets because:
Revenue driven by participation rates and pricing power rather than occupancy and average daily rates
Minimal seasonal construction risk (12-15 month builds versus 24-36 months for hotels)
Technology differentiation versus hospitality service quality factors
Strong impact credentials attracting different exit buyer pools
This provides diversification value within sustainable tourism portfolios.
Liquidity and duration matching:
Gateway investments suit 7-12 year fund structures typical of infrastructure and growth equity vehicles. Shorter payback periods (12-24 months) provide earlier cash distributions than hotels (36-48 months), improving fund-level IRR and DPI metrics.
Multiple exit pathways (strategic sale, portfolio sale, refinancing, local operator acquisition) provide liquidity flexibility that single-asset, illiquid tourism investments lack.
Impact thesis differentiation:
While accommodation and activity investments focus on operational sustainability (energy efficiency, waste reduction, local sourcing), gateways address systemic destination pressure. This creates complementary impact positioning:
Accommodation: Footprint reduction per visitor
Gateways: Total visitor pressure reduction across destination
Portfolio-level impact narratives benefit from this breadth across both operational sustainability and systemic destination management.
Investor implication: Allocate 5-15% of sustainable tourism portfolio to gateway investments, concentrating exposure in funds with operational expertise and 3-5 venue minimum deployment targets. Avoid gateway investments below €3-5M total committed capital, as single-venue scale lacks diversification and operational efficiency.
What technology trends affect gateway investment thesis?
Three technology evolution trajectories matter for gateway investors:
1. Consumer VR and AR adoption
Current consumer VR headsets (Meta Quest, Apple Vision Pro) deliver improving home entertainment experiences at decreasing price points. This could theoretically substitute for location-based immersive entertainment.
Investor assessment: Unlikely to materially impact gateway value proposition because:
Social/shared experience aspects remain differentiated (families, groups, travel companions prefer communal viewing)
Location-specific, high-production-value content difficult to replicate in consumer VR
Physical travel commitment creates willingness-to-pay for premium immersive experiences
Consumer VR adoption remains limited (<5% household penetration globally)
Mitigation: Focus gateway content on destination-specific narratives, ultra-high-resolution cinematography and spatial audio that exceeds consumer VR capability. Monitor consumer preference research; be prepared to integrate VR elements as complements rather than seeing VR purely as competition.
2. Projection and display technology improvements
LED displays, laser projection and holographic systems offer potential performance improvements and cost reductions versus current lamp-based projector systems.
Investor assessment: Positive for gateway economics because:
LED systems reduce operating costs (lamp replacement elimination, lower energy consumption)
Higher brightness and contrast improve daytime operation and outdoor venue feasibility
Longer lifespans (50,000+ hours vs 2,000-3,000 for lamps) reduce maintenance intensity
Investment strategy: Budget technology refresh cycles (Year 5-7 typical) to upgrade to next-generation systems. Early-stage investments may use proven lamp-based systems to reduce technology risk, with plan to upgrade as LED economics improve.
3. AI-generated content and virtual production
Artificial intelligence tools and virtual production stages (Unreal Engine, LED volume filming) dramatically reduce immersive content production costs and enable rapid customisation.
Investor assessment: Highly positive for gateway economics because:
Content production costs decline 30-50% as AI handles routine CGI, editing and localisation
Faster production cycles (4-6 months vs 8-12 months traditional) accelerate venue launches
Easier content updates and seasonal variations without full reproductions
Personalisation opportunities (language, cultural framing, interest areas) enhance visitor satisfaction
Investment strategy: Partner with production houses adopting AI and virtual production workflows. Specify content contracts with clear intellectual property rights enabling AI-assisted updates and derivatives. Budget content refresh at lower cost points than historical precedent.
Overall technology risk assessment: Moderate and manageable. Gateway investment thesis does not depend on specific technology platforms (content-agnostic infrastructure). Technology evolution creates opportunities (cost reduction, capability enhancement) more than existential threats. Standard infrastructure refresh budgeting addresses obsolescence risk.
How do currency risks affect international gateway portfolios?
Gateway investments deployed across jurisdictions face currency exposure that requires active management.
Revenue currency exposure:
Tourist visitation patterns determine revenue currency mix:
Domestic-heavy destinations generate revenue primarily in local currency
International destinations with EU visitors generate euro-denominated or euro-linked revenue (many destinations price in euros for international visitors)
Cruise-dependent locations often contract revenue in USD (cruise line payments)
Operating cost currency exposure:
Technology, content production and skilled labour often denominated in hard currencies (USD, EUR) even when venues located in emerging markets. This creates natural hedge: revenue in hard currency, costs also significantly hard-currency denominated.
Local operating costs (facilities, utilities, frontline labour) expose to local currency but represent minority of total cost structure (40-50% typically).
Capital expenditure currency exposure:
Dome structures, projection systems and audio equipment procured from US, European or Japanese manufacturers in USD or EUR. Currency movements between financing and equipment procurement can materially impact capital requirements.
Mitigation strategies:
Financing currency matching:
Deploy debt in revenue currency where possible (e.g., EUR debt for Mediterranean island gateways serving EU tourists)
Match equity commitments to expected revenue currency exposure
Avoid local currency financing for venues with hard currency revenue unless hedged
Operational hedging:
Contract with transport operators and cruise lines in hard currencies
Maintain pricing power to adjust local currency pricing as exchange rates move
Build 10-15% FX buffer into pro formas for emerging market deployments
Natural hedging through diversification:
Portfolio across multiple currencies creates partial offset
Overweight stable currencies (EUR, USD, GBP) while accepting emerging market exposure as subset
Active hedging:
Forward contracts for equipment procurement once orders placed
Currency swaps for debt service in mismatched currencies
Avoid over-hedging: some currency exposure acceptable given operational flexibility
Investor implication: Currency risk manageable but requires sophistication. Portfolios with >50% exposure to high-volatility currencies (emerging market locations with domestic visitor revenue) should implement hedging programmes. Diversified portfolios with balanced currency exposure can accept most risk unhedged.
What is typical investment horizon and capital deployment pace?
Infrastructure funds targeting gateway portfolios should structure with 8-10 year fund life, divided into 3-year investment period and 5-7 year hold/exit phase.
Investment period (Years 1-3):
Year 1:
Fundraising completion and first close
Destination pipeline development and feasibility assessments
Venue 1-2 site selection and partnership negotiations
Initial capital deployment: €3-5M
Year 2:
Venue 1-2 construction and commissioning
Venue 3-4 feasibility and site selection
First operations and early cash flow
Capital deployment: €4-6M
Year 3:
Venue 1-2 operational optimisation
Venue 3-6 construction and launch
Portfolio systems and centralised functions establishment
Capital deployment: €8-12M
End of investment period:
6-8 venues operational or under construction
€15-23M capital deployed
Portfolio approaching cash-flow positive at aggregate level
Hold and harvest period (Years 4-10):
Years 4-5:
Complete construction pipeline (Venue 7-10)
Operational maturity and efficiency improvements
Content refresh and second-generation productions
Begin exit preparation (financial audits, impact verification)
Years 6-8:
Portfolio operating at mature efficiency
Technology refresh cycles commencing
Strategic buyer engagement and exit negotiation
Initial venue sales or portfolio refinancing
Years 9-10:
Final exit execution (portfolio sale or remaining venue dispositions)
Distribution to limited partners
Fund wind-down
Capital deployment pace considerations:
Faster deployment (12-18 months vs 36 months) increases interest carry and reduces returns. Venues require 18-24 months from site selection to operational cash flow; parallel development of 2-3 venues creates natural pacing.
Optimal strategy: Deploy first €5-8M rapidly into proof-of-concept venues with highest conviction, then pace subsequent deployment based on performance validation and buyer interest signals.
Investor implications:
General partners should target $20-40M fund sizes for meaningful gateway portfolios (8-15 venues). Smaller funds risk under-diversification; larger funds struggle to deploy capital without compromising site selection discipline.
Limited partners should expect 1-2 year J-curve (negative cash flow during construction) followed by 5-7 years of positive distributions as venues mature and portfolio exits commence.
Data resources for investor due diligence
Systematic destination analysis and investor landscape mapping inform underwriting and portfolio construction.
Immersive Investors dataset
Profiles 45 investors and related entities active in immersive infrastructure, tourism, culture and conservation sectors. Approximately one-third position explicitly as impact funds or DFIs.
Use this dataset to identify potential co-investors, benchmark investment strategies and understand competitive landscape.
Immersive Destination Analysis dataset
Profiles 88 tourism and investment destinations with focus on overtourism signals, protected area concentrations and sustainability pressure. Approximately 37% show explicit overtourism indicators.
Use this dataset for pipeline development, site selection and underwriting destination-specific risks and opportunities.
immersive-destination-marketing dataset
Underlying dataset with detailed destination and attraction profiles including visitor estimates, protected area ratios and tourism dependency.
These datasets are maintained as open resources supporting evidence-based investment decision-making in sustainable tourism infrastructure.
Conclusion: The case for early-mover allocation
Immersive tourism infrastructure represents an emerging asset class at the intersection of three investment themes: infrastructure (predictable cash flows, operational scalability), impact (measurable environmental and social outcomes) and growth (structural demand from overtourism and conservation imperatives).
Unit economics demonstrate that well-sited gateway venues generate returns comparable to middle-market infrastructure (15-25% IRR) while delivering impact credentials that conventional tourism assets cannot match. The combination of 12-24 month payback periods, 65-70% EBITDA margins and multiple exit pathways creates compelling risk-adjusted return profiles for investors comfortable with operational infrastructure.
The asset class remains early-stage with fragmented competitive landscape and limited dedicated capital deployment. This creates first-mover advantages: access to best destination partnerships, ability to establish operational best practices and brand recognition, and credibility with impact-focused exit buyers.
Investors should structure gateway exposure as dedicated allocations within sustainable tourism or impact infrastructure portfolios rather than opportunistic single-deal investments. Target deployment of €15-40M across 8-15 venues over 3-4 year investment periods, balancing geographic diversification with operational efficiency.
Early-stage risks centre on execution (development delays, cost overruns, technology integration), operations (participation rates, seasonality management) and market (tourism demand volatility). Experienced infrastructure investors can mitigate these through disciplined due diligence, staged deployment strategies and partnership with destination-focused developers like Origin of Wonder.
The question for impact investors is not whether immersive tourism infrastructure will scale as an asset class – destination pressure and conservation finance trends make this trajectory clear – but whether to allocate capital during the current early-mover window or wait for market maturation that brings increased competition and compressed returns.
For investors seeking to deploy impact-oriented capital into infrastructure with credible dual returns, immersive gateways warrant serious portfolio consideration.
About the analysis: This investment perspective draws on systematic profiling of 45 immersive investors, destination analysis across 88 locations and unit economics from operational gateway venues. The author (Martin Sambauer) works with Origin of Wonder to develop investment-ready gateway portfolios.
Data availability: All referenced datasets are openly available on GitHub with full methodology documentation.
Investor enquiries:
Partnership and co-investment: originsofwonder.com/investor-relations
Due diligence support: originsofwonder.com/contact
Portfolio analysis: originsofwonder.com/feasibility-assessment